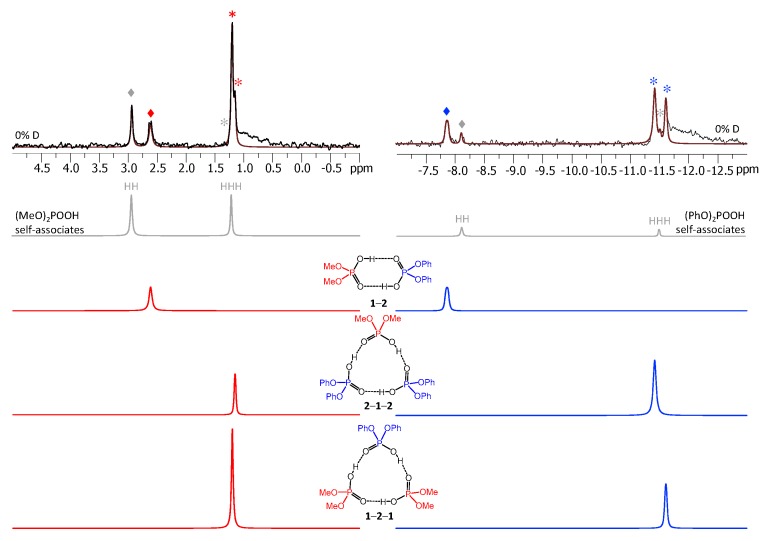
Figure 4.
The parts of 31P-NMR spectrum of the sample containing acids 1 and 2 (1:1) in CDF3/CDF2Cl at 100 K. The experimental spectrum is deconvoluted into the sub-spectra arising from self-associated of 1 or 2, heterodimer 1-2, and two heterotrimers, 1-2-1 and 2-1-2. For visual clarify the signals in the experimental spectrum and the computed sub-spectra are color coded. Trimers and dimers are marked by asterisks and diamonds, respectively.

