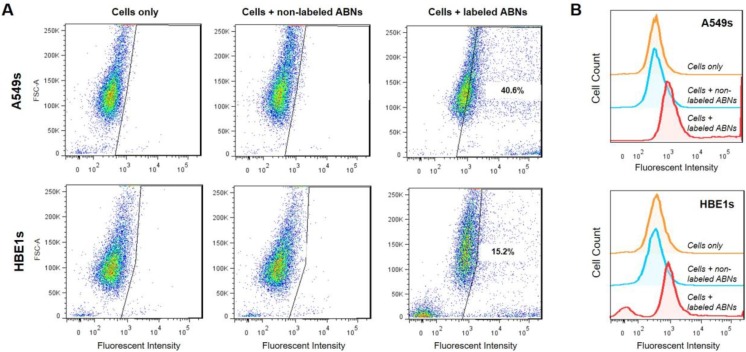
Figure 2.
(A) Flow cytometry was used to determine A549 (top panel) and HBE1 (bottom panel) cancer and nontransformed ABN positive cell populations after 12 h of culture with no treatment, treatment with non-labeled ABNs, or treatment with AlexaFluor 647-labeled ABNs (100 µg ABNs/mL media). (B) Cell count curves plotted on a log scale for control and experimental groups.

