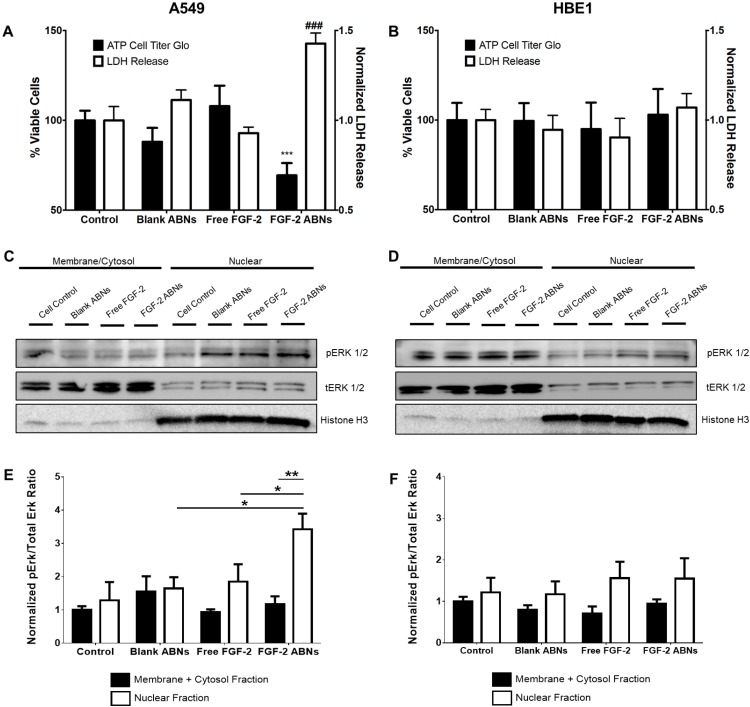
Figure 6.
In vitro normalized viable cell number and LDH release for (A) A549 cancer and (B) HBE1 nontransformed cells after exposure to blank ABNs (100 µg/mL), free FGF-2 (20 ng/mL), and FGF-2-loaded ABNs (100 µg/mL). Western blot gel band images of membrane/cytosol and nuclear pERK1/2 and tERK1/2 activation for (C) A549 and (D) HBE1 cells. Relative intensity ratios of western blot gel bands for pERK/tERK ratios in both membrane/cytosol and nuclear fractions for (E) A549 and (F) HBE1 cells.

