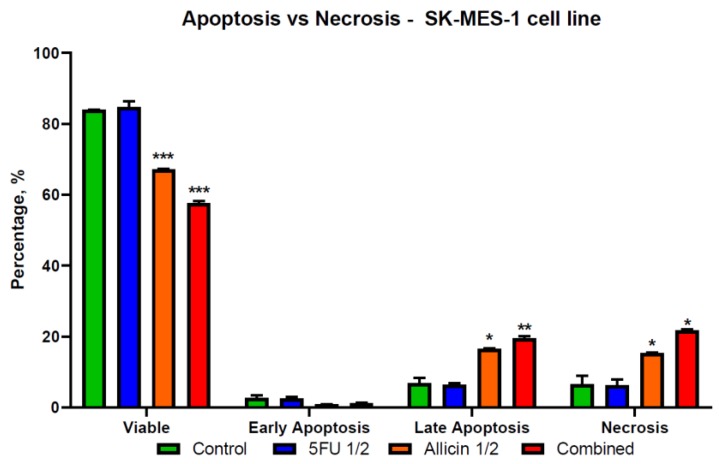
Figure 9.
The illustration of apoptosis and necrosis in the SK-MES-1 cell population. SK-MES-1 cell line ratio between viable, apoptotic, and necrotic cells, with an increased number of late apoptotic and necrotic cells. The graphics were analyzed using Prism8 software. Abbreviations: Control, control group; 5-FU 1/2, half of the 5-FU IC50-treated group; Allicin 1/2, half of the Allicin IC50-treated group; Combined, the co-treatment group. The results with p < 0.05 were considered statistically significant (* p < 0.05, ** p < 0.01, and *** p < 0.001).

