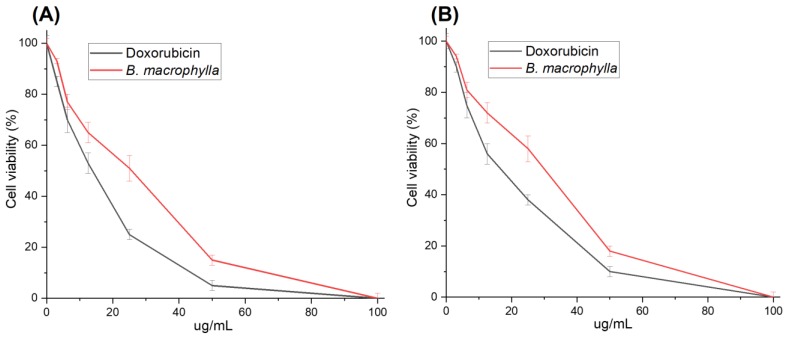
Figure 4.
Cell survival curves of HeLa (A) and HCT116 (B) cell lines treated for 48 h with Doxorubicin and the B. macrophylla ethanol extract at difference concentrations. Data are shown as mean ± SD of three independent experiments (* p < 0.05; the mean difference is significant at the 0.05 level compared to the control by one-way ANOVA).

