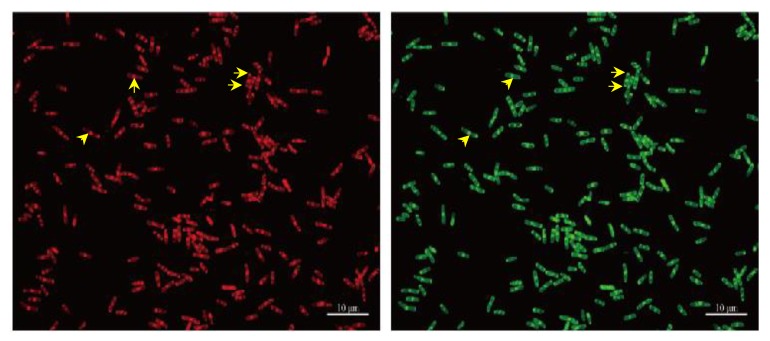
Figure 7.
Fluorescence microscopy images of B. subtilis stained with PEG6000/CDs. Cells were stained with the concentrations of PEG6000/CD at 100 ppm. TRITC filter detected red color, while FITC filter detected green color. Scale bar represents 10 μm. Yellow arrows point to cell septa and cell poles.

