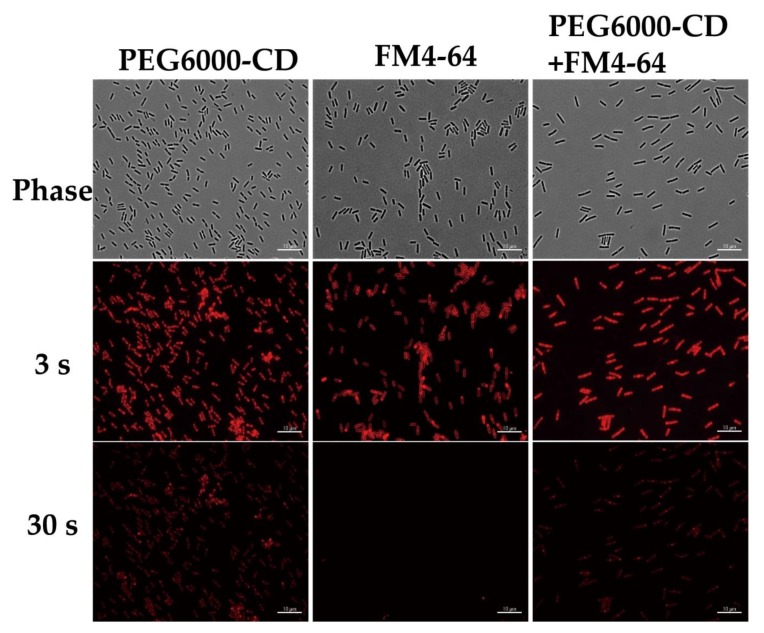
Figure 9.
Fluorescence microscopy images of B. subtilis stained with PEG6000/CDs and FM4-64 membrane dye and excited with t 490 nm wavelength for two different durations (3 s and 30 s) before imaging. Cells were stained with PEG6000/CDs at 100 ppm. Control cells were assayed similarly without adding PEG6000/CDs. TRITC filter detected red color. Scale bar represents 10 μm.

