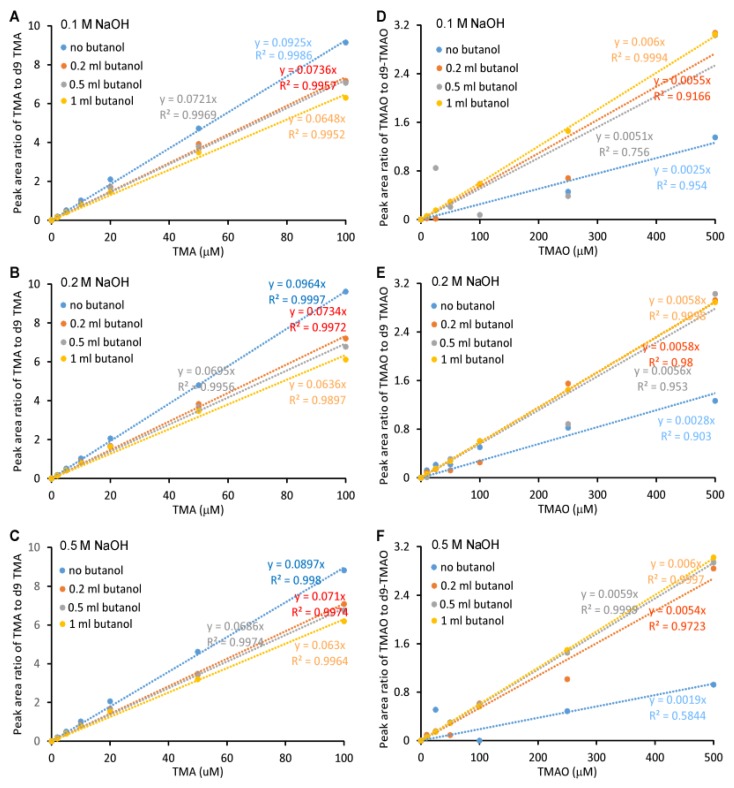
Figure 3.
Standard curves for the Liquid Chromatography Electrospray Ionization Tandem Mass Spectrometric (LC/ESI/MS/MS) analysis of TMA and TMAO. Here, 500 μL of varying concentrations of TMA and TMAO were mixed with 20 μL of 1 mM (d9-TMA + d9-TMAO) and extracted with 2 mL hexane and different volumes of butanol in the presence of 1 mL NaOH at varying concentrations ((A, D), 0.1 M; (B, E) 0.2 M; (C, F), 0.5 M). Then, analytes were transferred to the aqueous phase by adding 0.2 mL of 0.2 M formic acid. Curves were plotted as the peak area ratio of TMA to d9-TMA (A–C) and TMAO to d9-TMAO (D–F) versus concentration. Data were acquired in a QTRAP5500 mass spectrometer with a Shimadzu auto-sampler and a LC pump system.

