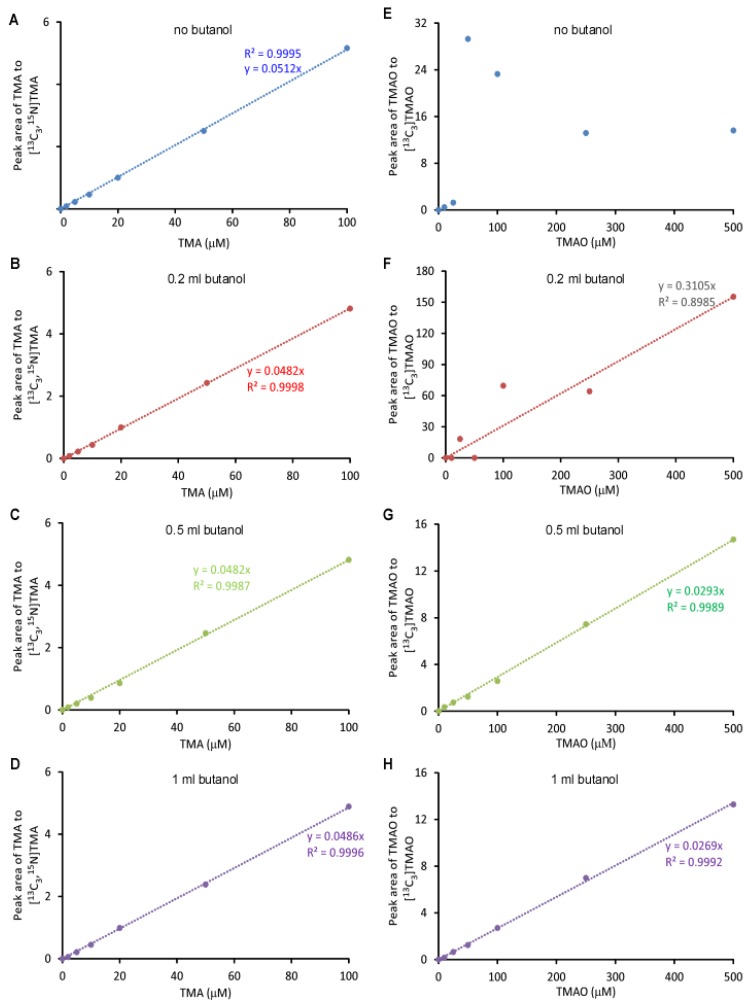
Figure 4.
Standard curves for the LC/ESI/MS/MS analysis of TMA and TMAO with [13C3,15N]TMA and [13C3]TMAO as internal standards, respectively. Here, 500 μL of varying concentrations of TMA and TMAO were mixed with 20 μL of 1 mM [13C3, 15N]TMA and 1 mM [13C3]TMAO and extracted with 2 mL hexane and varying volumes of butanol (no butanol (A,E), 0.2 mL butanol (B,F), 0.5 mL butanol (C,G), 1 mL butanol (D,H)) in the presence of 1 mL 0.5 M NaOH. Then, analytes were transferred to the aqueous phase by adding 0.2 mL of 0.2 M formic acid. The analysis was performed using electrospray ionization in positive-ion mode with multiple reaction monitoring of precursor and characteristic product ions. The transitions monitored were mass-to-charge ratio (m/z): m/z 60 → 44, m/z 64 → 47, m/z 76 → 58 and m/z 79 → 61 for TMA, [13C3, 15N]TMA, TMAO and [13C3]TMAO, respectively. Curves were plotted as the peak area ratio of TMA to [13C3, 15N]TMA (A–D) and TMAO to [13C] TMAO (E–H) versus concentration. Data were acquired in a Thermo Quantiva interfaced with a Vanquish LC system with 0.5 μL injection to column.

