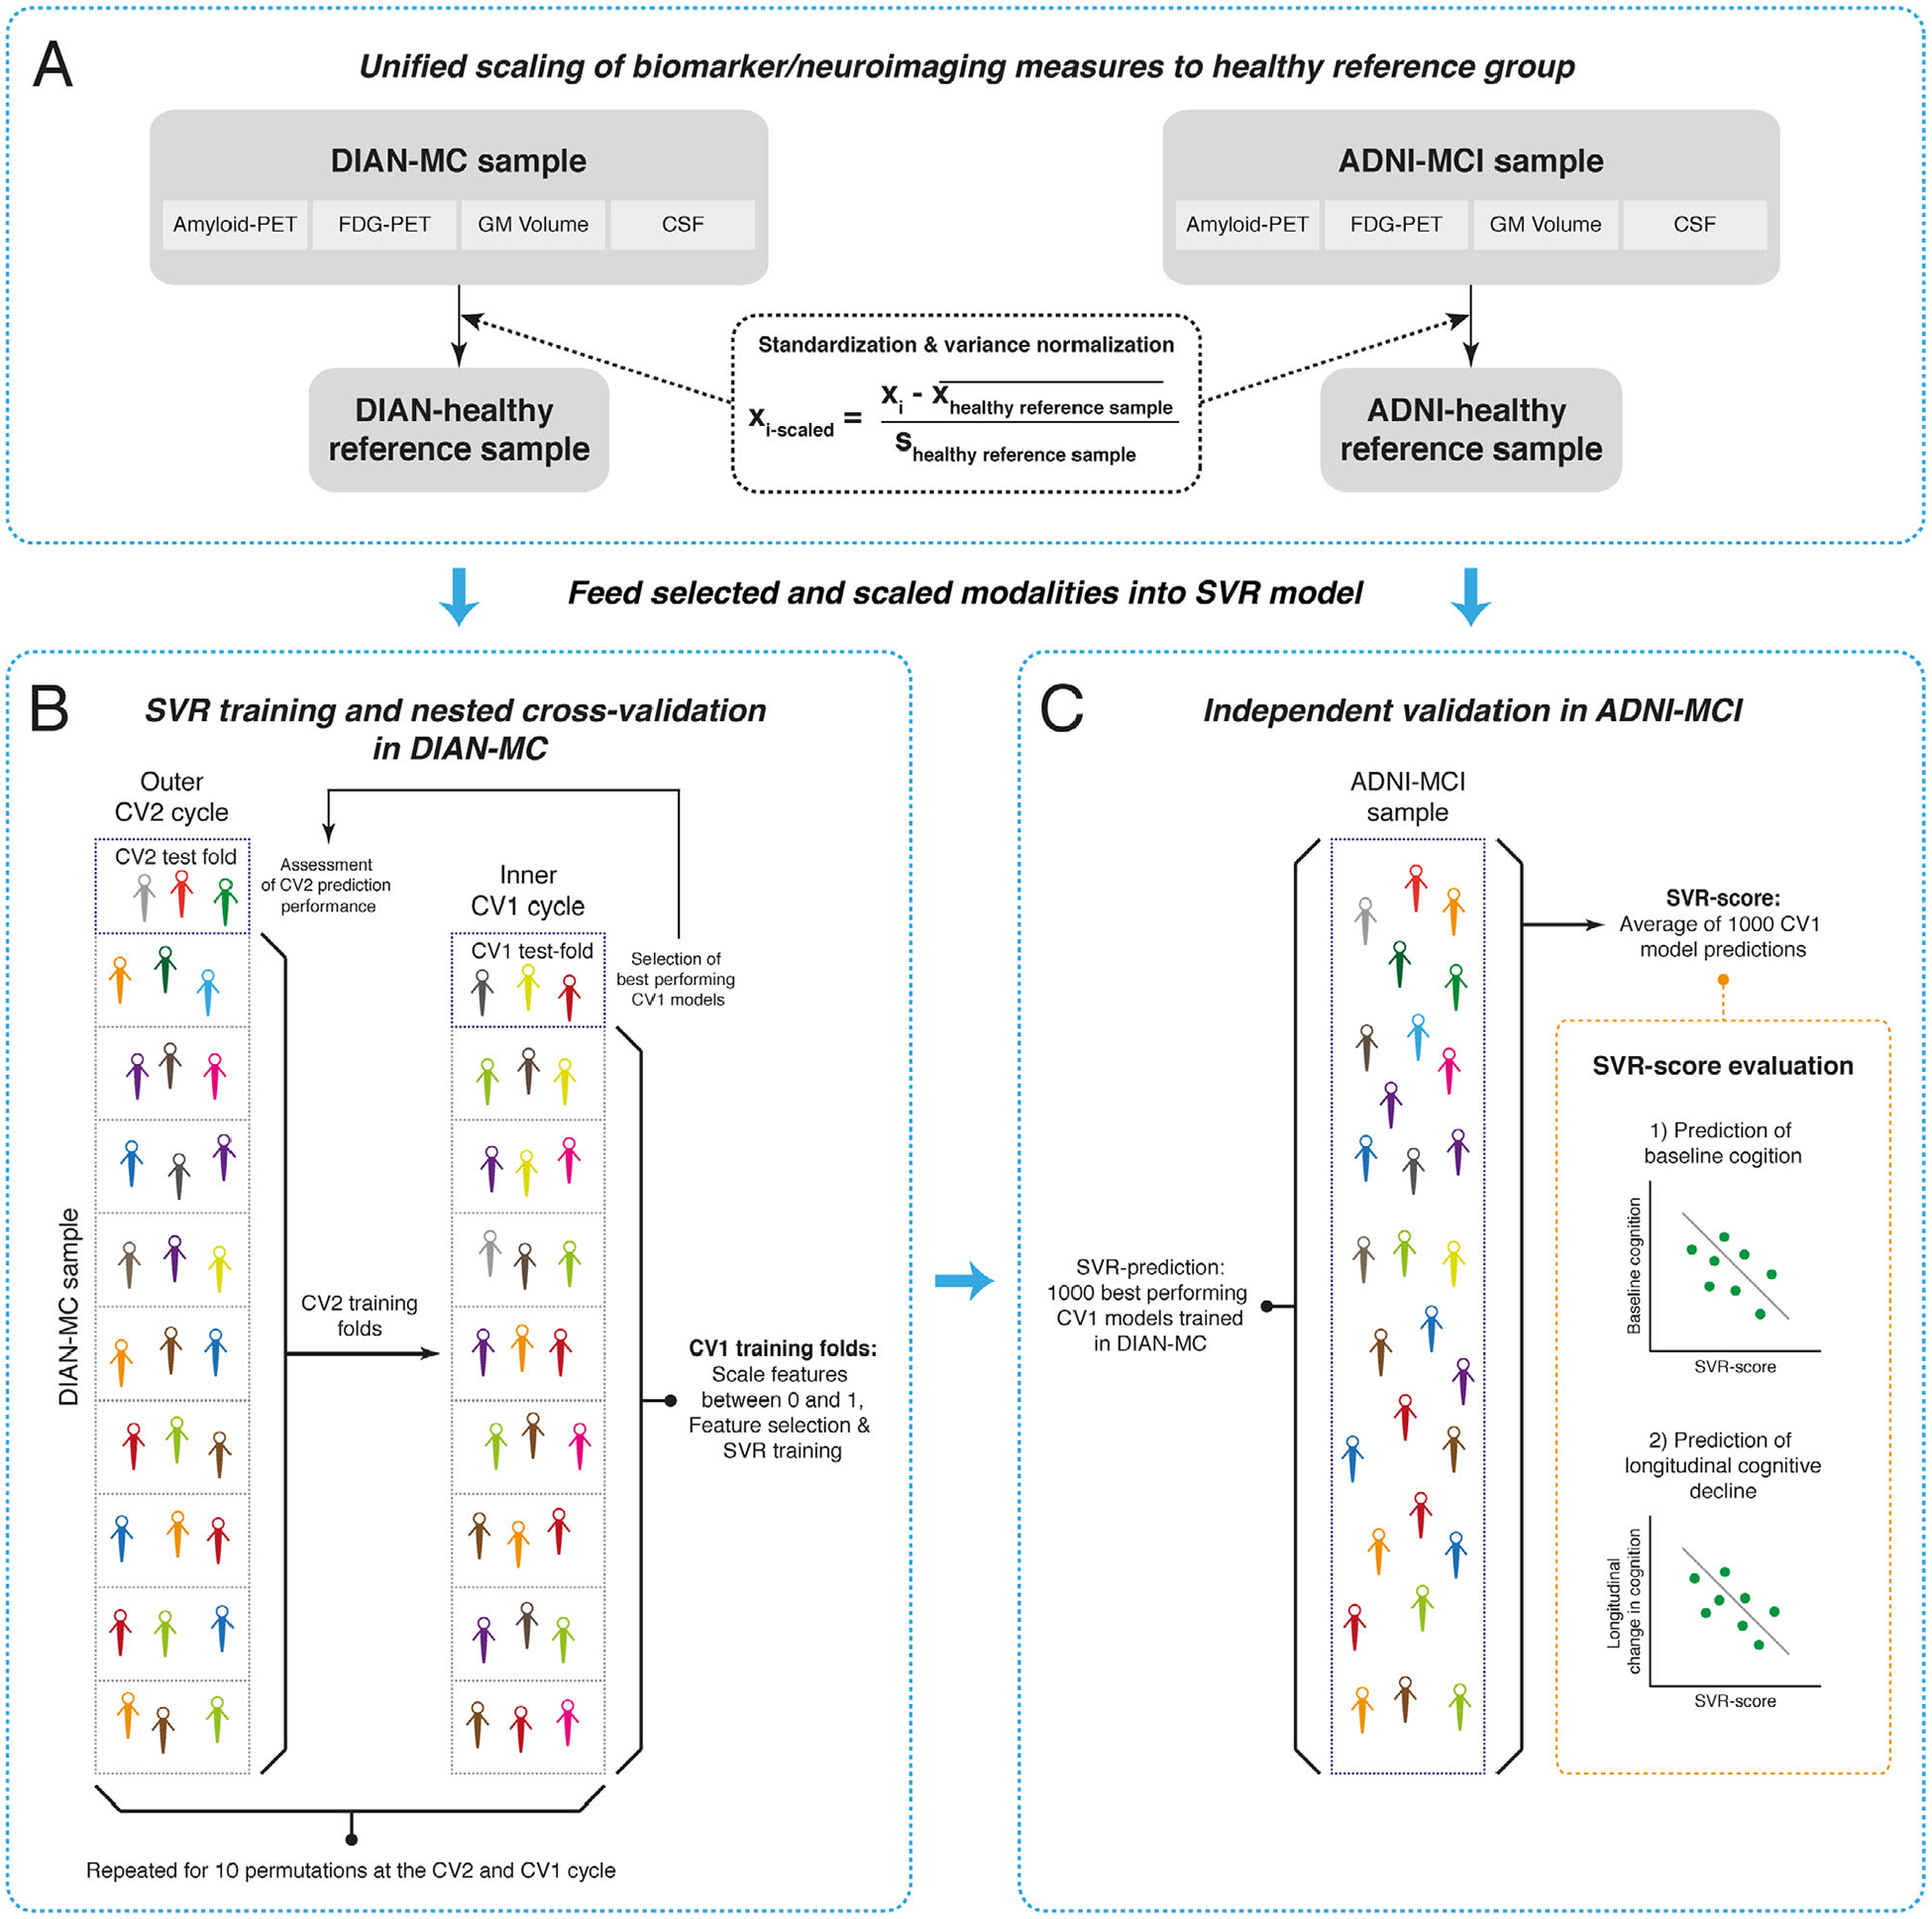
FIGURE 1.

Flow-chart of the support vector regression (SVR) analysis pipeline. (A) Selected data from the DIAN-MC and ADNI-MCI sample are standardized and variance normalized to the respective healthy reference groups to ensure comparability of biomarker scaling across samples. (B) The SVR model is trained based on selected modalities in DIAN-MC in a nested cross-validation framework. (C) The trained SVR-models are blindly applied to the scaled ADNI-MCI biomarker data yielding a SVR score per subject. The SVR score is then evaluated as a predictor of baseline cognition and longitudinal cognitive decline in ADNI
