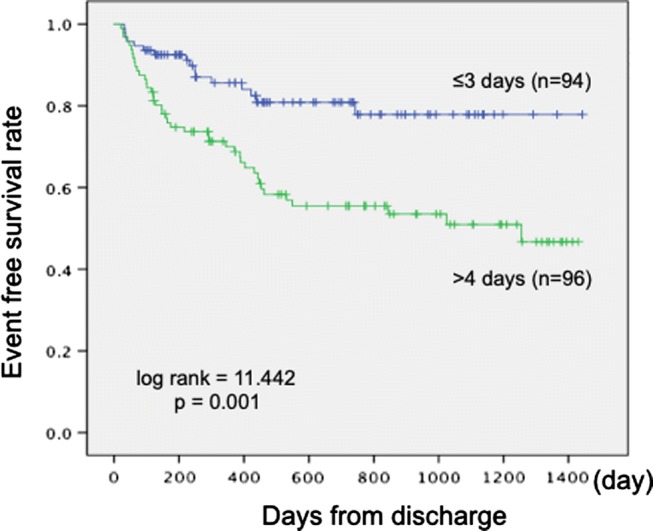
Fig. 2.

Kaplan–Meier survival curves for the period (in days) to a cardiac event. The subjects were divided into two groups according to whether the time between admission and mobilization was ≤ 3 days (blue curve) or ≥ 4 days (green curve). There was a significantly lower incidence of cardiac events in the group with earlier mobilization (log rank = 11.442, p = 0.001)
