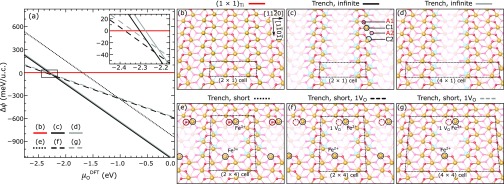
Figure 6.
Surface phase diagram and structures of Ti-doped Fe2O3(11̅02) as a function of μODFT. (a) Formation energies per Ti atom and per (1 × 1) unit cell of trench structures with different spacings, relative to surfaces with the same amount of Ti doping in the subsurface, but without trenches, i.e., a combination of undoped (1 × 1) and the (1 × 1)Ti structure of panel (b) (see Section 2.8 for details). The inset shows the region around μO = −2.3 eV in greater detail. (b) Perspective view of the (1 × 1)Ti structure with two Ti atoms per (2 × 1) unit cell. (c, d) Perspective views of trenches indefinitely extended along the [11̅01̅] direction, with a periodicity of two and four unit cells along the [112̅0] direction, respectively; (e–g) short trenches with and without one additional oxygen vacancy (VO) per supercell. The dimensions of the supercells are indicated in the panels.

