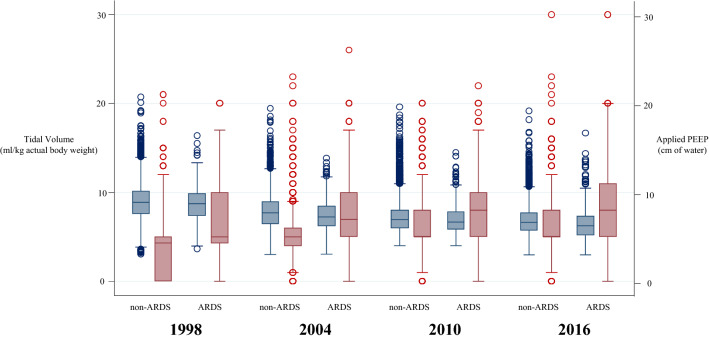
Fig. 1.
Changes over time in tidal volume (blue box plot) and positive end-expiratory pressure (red box plot) set at initiation of mechanical ventilation in patients without criteria of acute respiratory distress syndrome (ARDS) and patients with ARDS. For each box plot, the middle line represents the median, the lower hinge represents the first quartile, the upper hinge represents the third quartile, the whiskers extend to 1.5 times interquartile range, and the outliers are values outside the whiskers’ range

