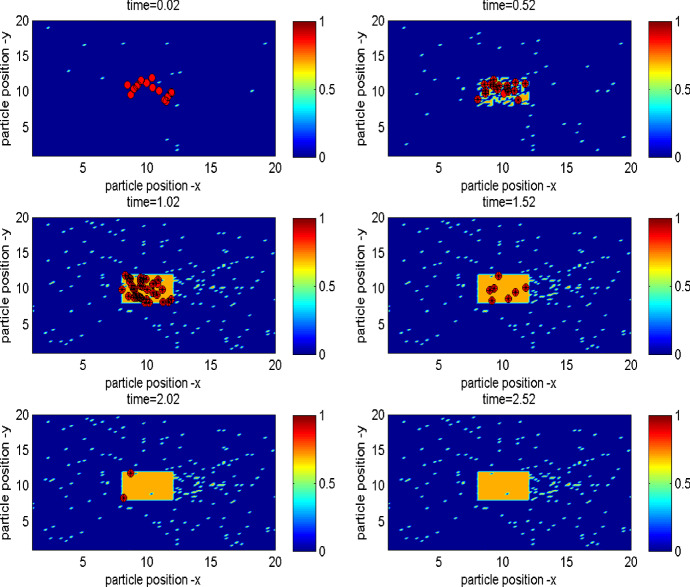
Fig. 13.
Illustration of the infection dynamics, movement and uniform isolation strategy. Black and green dots represent susceptible and recovered individuals, respectively, red dots represent individuals infected either by infected individuals or by the pathogen, purple dots denote individuals infected by bacteria, light-blue dots indicate individuals recovering from pathogen infection (Color figure online)

