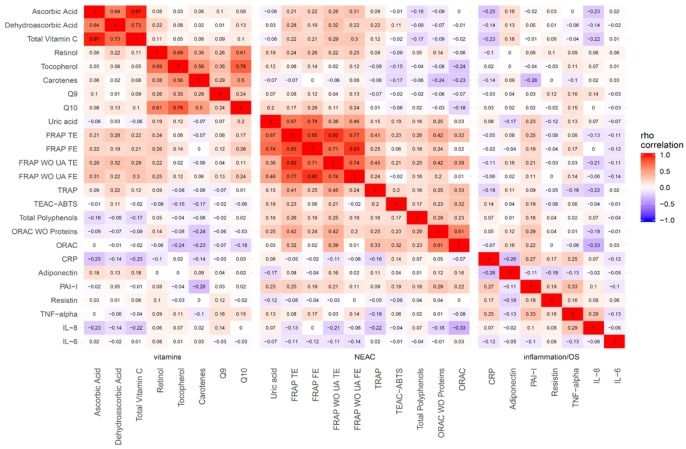
Figure 1.
Correlation matrix between biomarkers depicted as a heatmap. (Heat map represents the color-coded correlation factors between all biomarkers including levels of P-NEAC, nutrient antioxidants and biomarkers of inflammation in the EPIC Granada-Gipuzkoa study. The color value of the cells is proportional to the strength of the associations, ranging from red (positive correlations) to blue (negative correlations). The strength of the correlation is indicated in the color scale (at the right of the panel). Pair-wise spearman correlation coefficients (rho) are shown in every cell. Abbreviations: WO = without; UA = uric acid; OS = oxidative stress.

