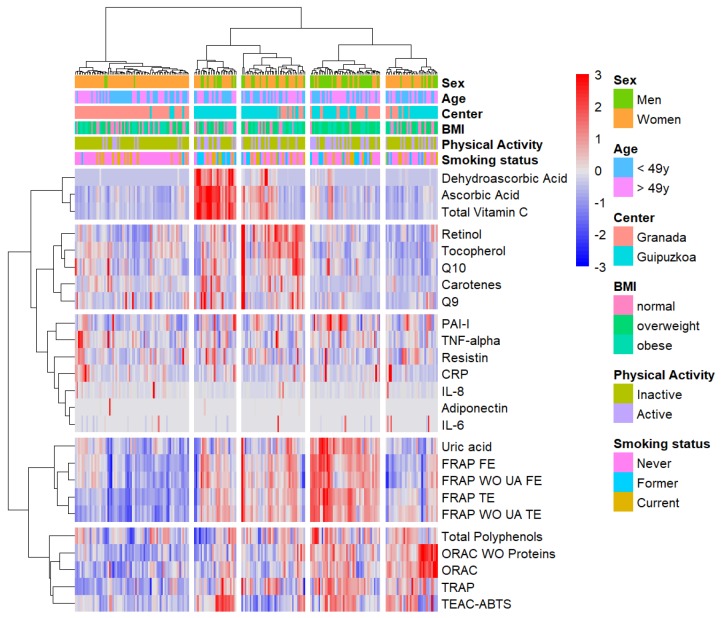
Figure 2.
Hierarchical clustering analysis of the analyzed biomarkers across the samples. Unsupervised hierarchical clustering diagram for biomarker levels in 210 samples of the EPIC Granada-Gipuzkoa study. Subjects (samples) were clustered into hierarchical trees based on the levels of the biomarkers, which were clustered by their similarity (Manhattan distances). The clustering separated the biomarkers and subjects into distinct groups. The joined clusters minimized the maximum within-cluster distance. This value is the “height” at which the clusters merged, as indicated in the dendrogram, with height represented on the y-axis. The lower the y-axis value, the lower distance between the clusters and the stronger their relationship. Red indicates high biomarker levels and blue indicates low biomarker levels. Missing data in certain biomarkers appears in white.

