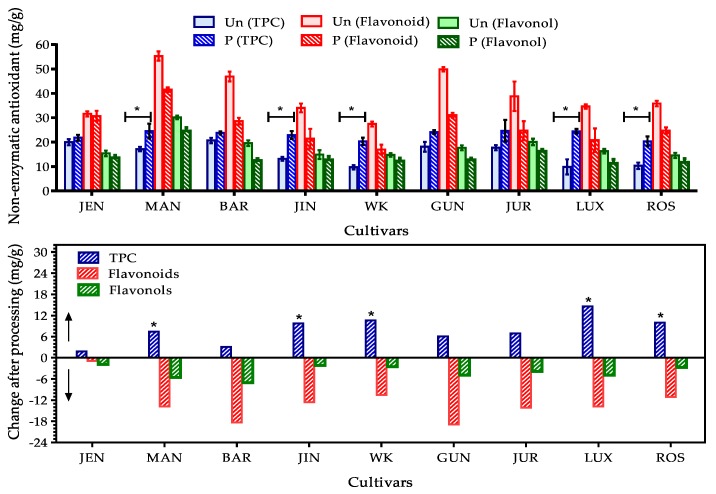
Figure 3.
TPC, total flavonoids and flavonols contents of nine cultivars of lupin flour. The TPC, total flavonoids and flavonols contents of nine cultivars of lupin flour before and after processing. Values were represented as mean ± SEM where number of replicates was 3. Signified comparison of mean of processed vs. unprocessed flours. * Significance at p < 0.05 (unprocessed vs. processed condition). Upside arrow on top panel signified increase of TPC whereas downside arrow on bottom panel signified decrease of flavonoid and flavonol in processed flour compared to unprocessed one.

