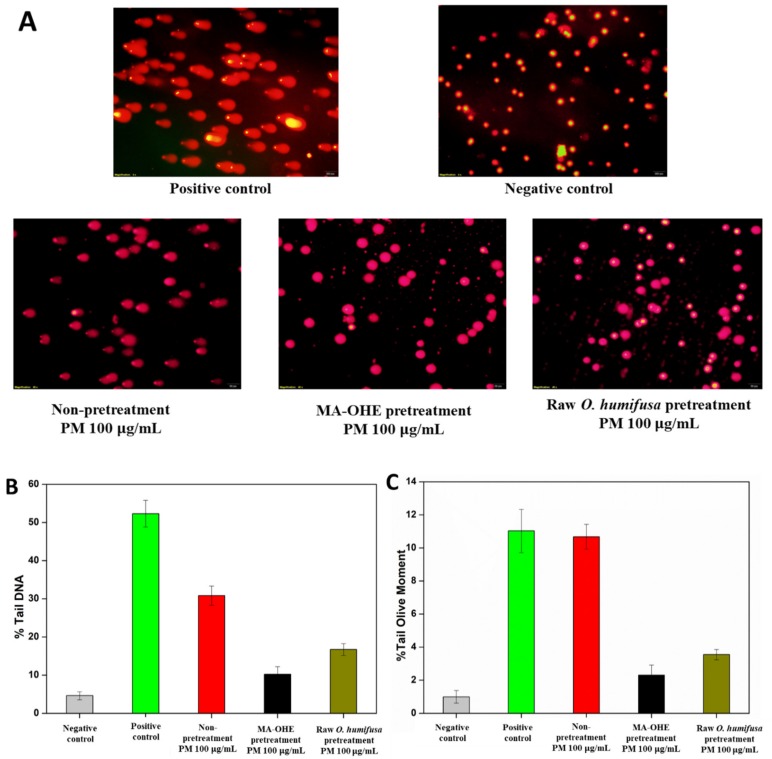
Figure 6.
Evaluation of the genotoxicity on HaCaT cells caused by MA-OHE and PM after 24 h of treatment by using the comet assay: (A) fluorescence images representative of HaCaT cells after electrophoresis (Scale bar = 250 µm); (B) tail DNA damage (%); (C) tail olive moment (%) (p < 0.05, significant difference is in comparison with the control).

