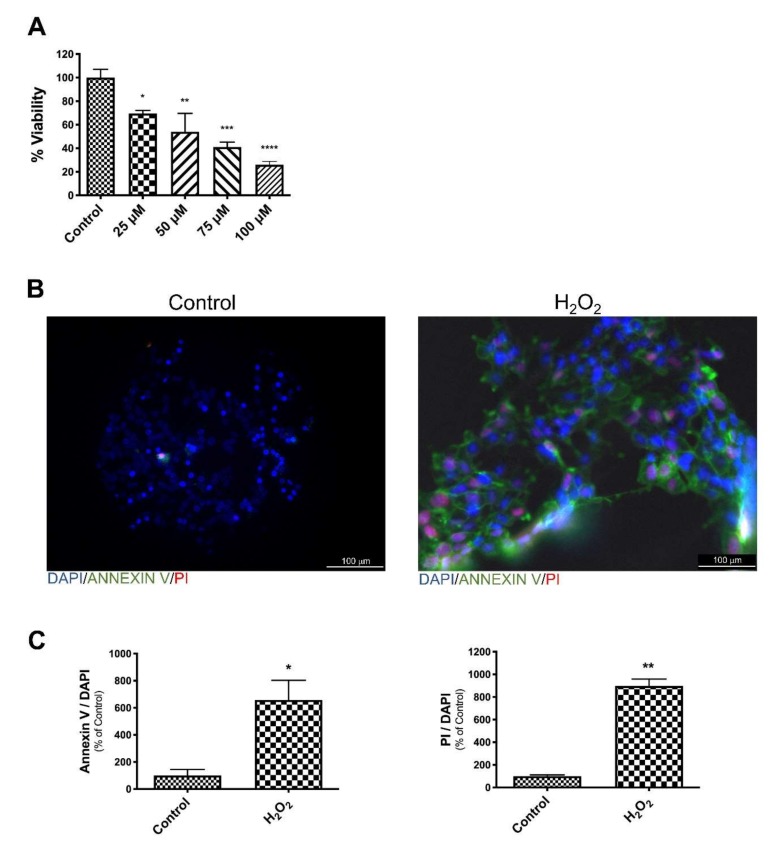
Figure 1.
H2O2 affects SK-N-BE cell viability. Cell viability decrease after treatments with different concentration of H2O2 (A). representative images of DAPI, Annexin V-FITC and PI triple fluorescence staining showing cellular apoptosis after H2O2 treatment. DAPI: blue; AnnexinV: green; PI: red (B). Histograms reports quantification of fluorescence of DAPI, Annexin V, and PI (C). The bars represent ± the average ± SD of independent experiments (n = 3). Statistically significant difference compared to control cells: * p ≤ 0.05, ** p ≤ 0.01, *** p ≤ 0.001, **** p ≤ 0.0001.

