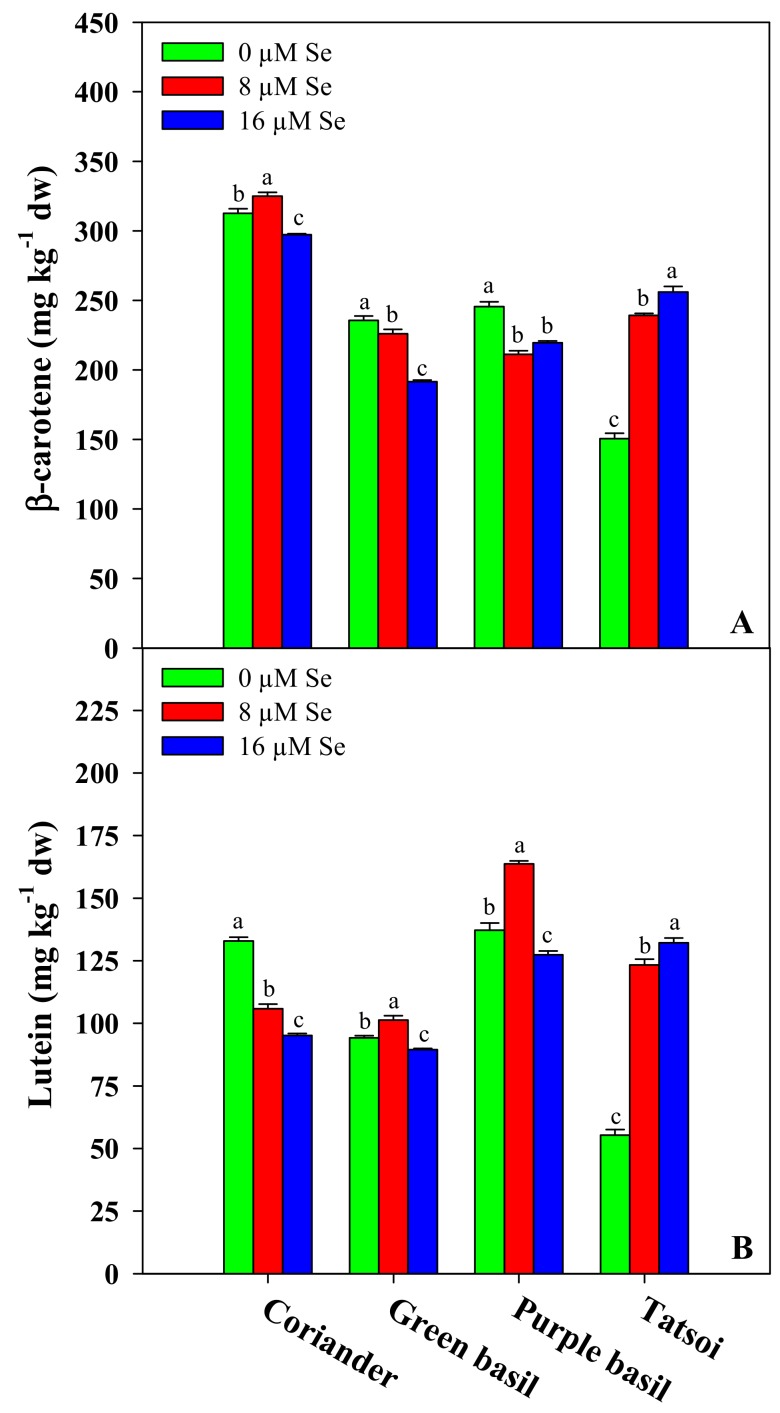
Figure 3.
Effects of the selenium concentration on the β-carotene (A) and lutein (B) contents of four microgreen genotypes grown in a growth chamber on a capillary mat substrate under three Se concentrations applied in the nutrient solution. The different letters (a–c) above the bars indicate significant mean differences within each genotype according to Duncan’s multiple range tests (p ≤ 0.05). The values are the means of three replicates. Vertical bars indicate ± SE of means.

