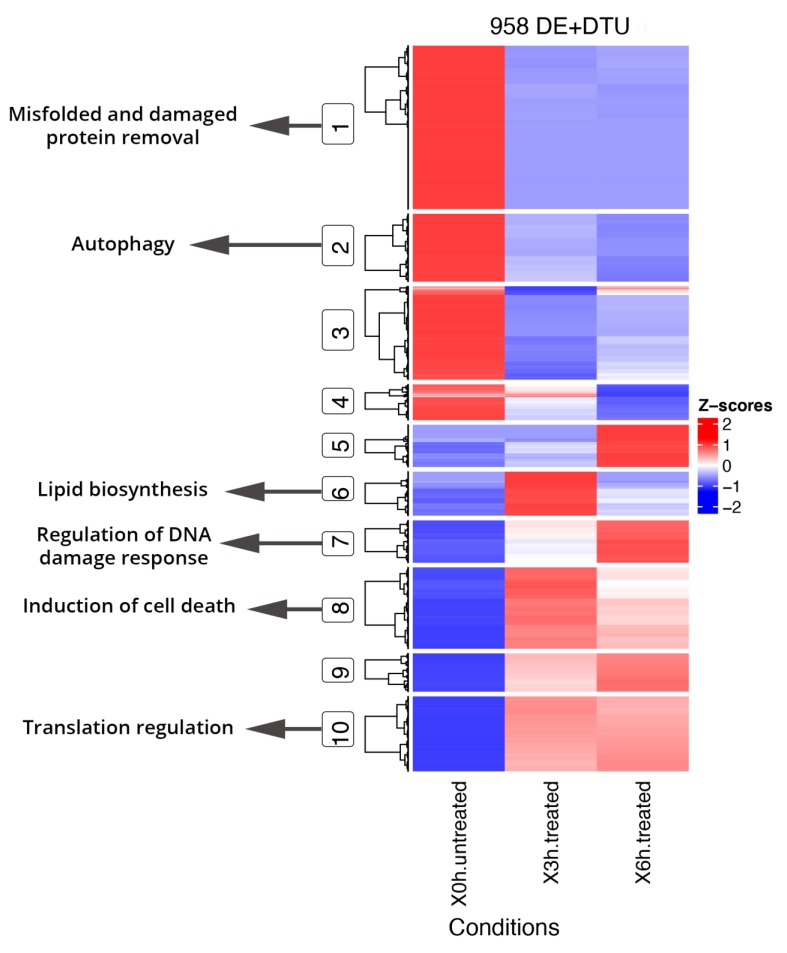
Figure 5.
Hierarchical clustering and heatmap of DE genes + DTU transcripts from DAS genes and Key GO terms. DE genes and DTU transcripts from DAS genes show segregation into 10 coexpressed clusters, of which the main ones related to oxidative stress were highlighted (circled) and linked to GO specific terms. Full results of GO enrichment analyses are shown in Tables S6 and S7. The z-score scale represents mean-subtracted regularized log-transformed TPMs.

