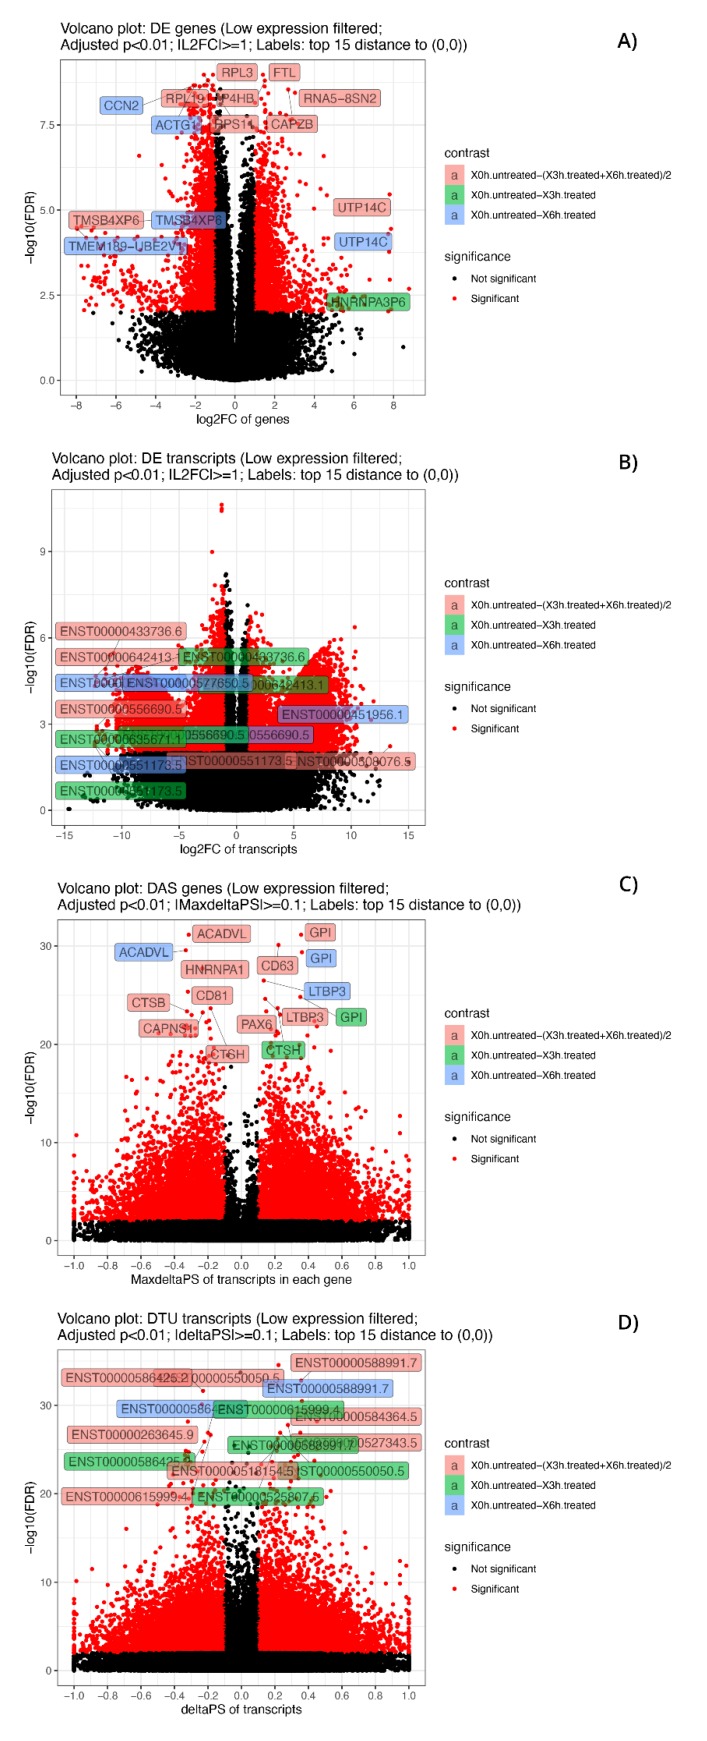
Figure 6.
Volcano plots of significant DE and DAS genes and of DE and DTU transcripts. Volcano plots of significant (adjusted p-value < 0.01) DE genes (A), DE transcripts (B), DAS genes (C) and DTU transcripts (D). The low expressed genes and transcripts were filtered. The top 15 considered elements with the smallest corrected p-values and bigger fold-changes are highlighted, and different colors refer to different contrast groups. DE genes: log2FC vs. −log10(FDR) at gene level; DAS genes: maximum ΔPS of transcript in a gene vs. −log10(FDR) at gene level; DE transcripts: log2FC vs. −log10(FDR) at gene level at transcript level and DTU transcripts: ΔPS vs. −log10(FDR) at transcript level.

