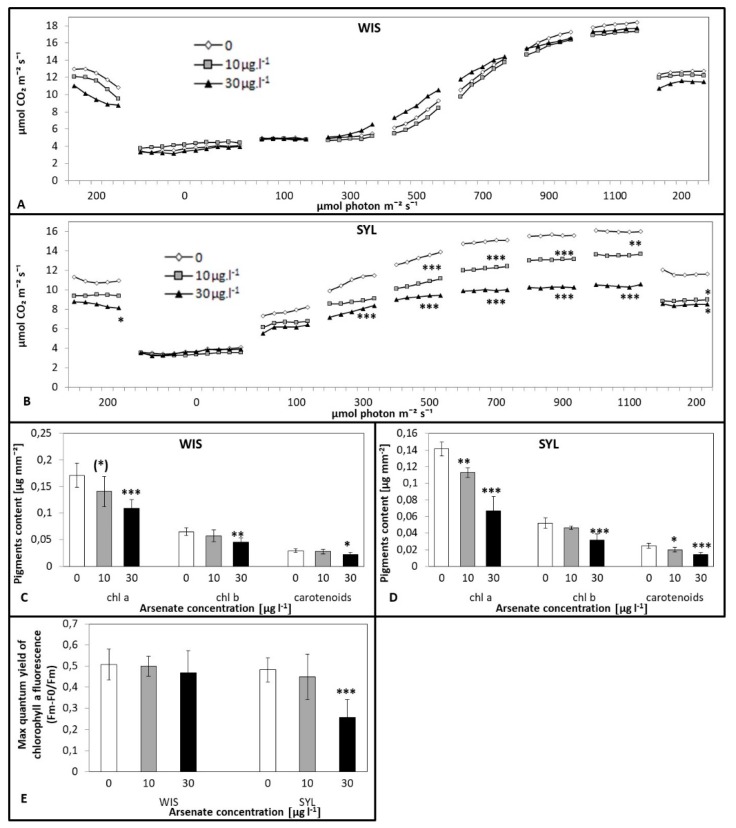
Figure 2.
Effects of arsenic on the net photosynthesis rate under different irradiances (A,B), pigments contents (C,D), and chlorophyll a fluorescence (E) in two contrasting tobacco genotypes (A,C) tolerant N.tabacum cv.Wisconsin; (B,D) sensitive N. sylvestris). 0, 10, and 30 µg l−1 arsenate concentrations. Bars indicate standard deviations. Stars mean statistically significant differences from control at the level α = 0.1 ((*)), 0.05(*), 0.01 (**) or 0.001(***), n = 5.

