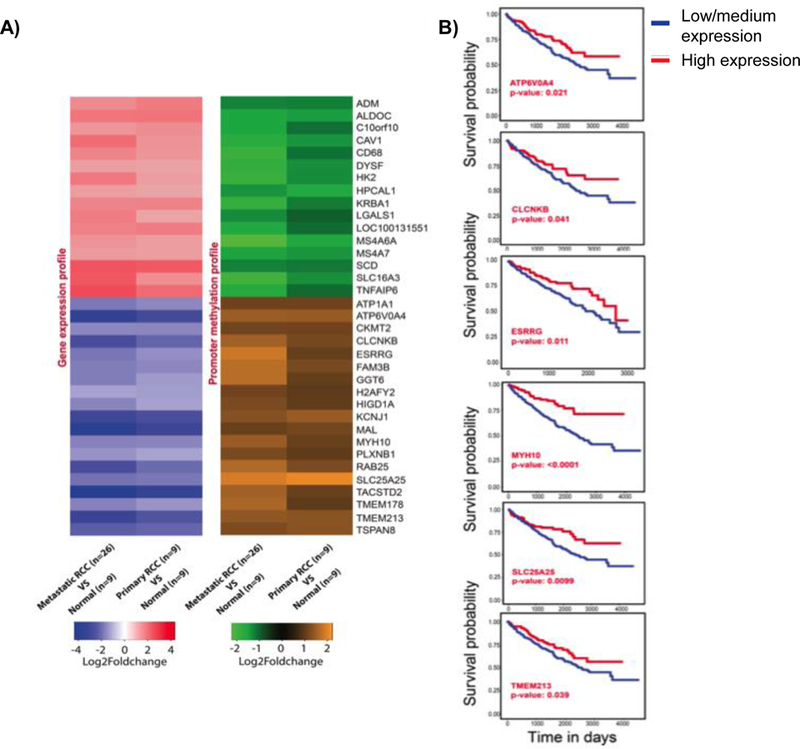
Figure 2. Transcriptome and methylome alterations in biologically aggressive kidney cancer.

A) Heatmaps showing gene expression and DNA methylation profile of 35 RCC associated genes. Fold change value for each gene is represented by the probe with highest value. Fold change cut-off of 2 and P-value limit of 0.05 were considered to obtain differentially expressed or differentially methylated probes. B) Survival analysis of down-regulated genes SLC25A25, ESRRG, TEMEM213, MYH10, CLCNKB, and ATP6V0A4 using TCGA data. The KM plots were obtained from UALCAN (http://ualcan.path.uab.edu), which uses level 3 RNA-seq data and survival information from TCGA kidney renal clear cell carcinoma (KIRC) patients (n=533). The significance of difference between survival curves was obtained by log rank test.
