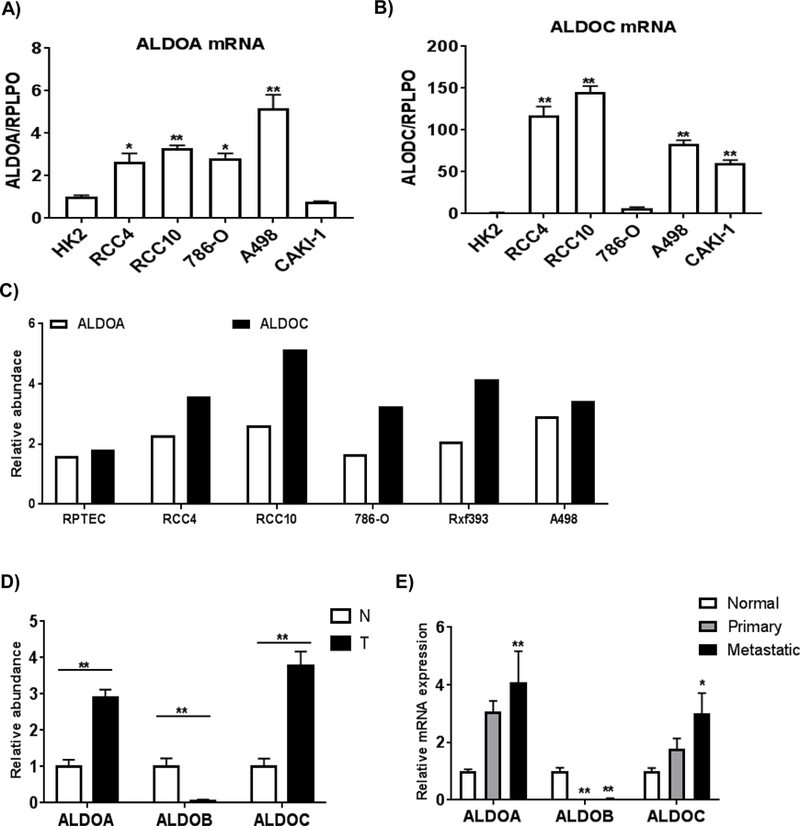
Figure 3. The differential distribution of aldolases in RCC cells.

A) and B) Relative mRNA expressions of ALDOA and ALDOC in RCC cells. Total RNA was isolated from RCC cells and renal proximal tubular epithelial cells (HK2) (n=4/group). Transcript levels were normalized to those of RPLPO. Values are means ± SEM and asterisks indicate the differences relative to HK2 cells (*p<0.05, **p<0.01). C) Relative protein levels of aldolases in RCC cells compared to primary renal proximal tubule epithelial cells (RPTEC) by LC-MS proteomic analysis. D) Relative protein levels of aldolases in normal and tumor tissues by LC-MS proteomic analysis (n=5/group). Asterisks indicate difference relative to normal kidney tissue (*p<0.05, **p<0.01). E) Relative mRNA expressions of aldolase genes in patient-matched normal kidney, primary and metastasis were measured by RT-qPCR (n=11/ group). Values are means ± SEM and asterisks indicate the differences relative to normal kidney tissue (*p<0.05, **p<0.01).
