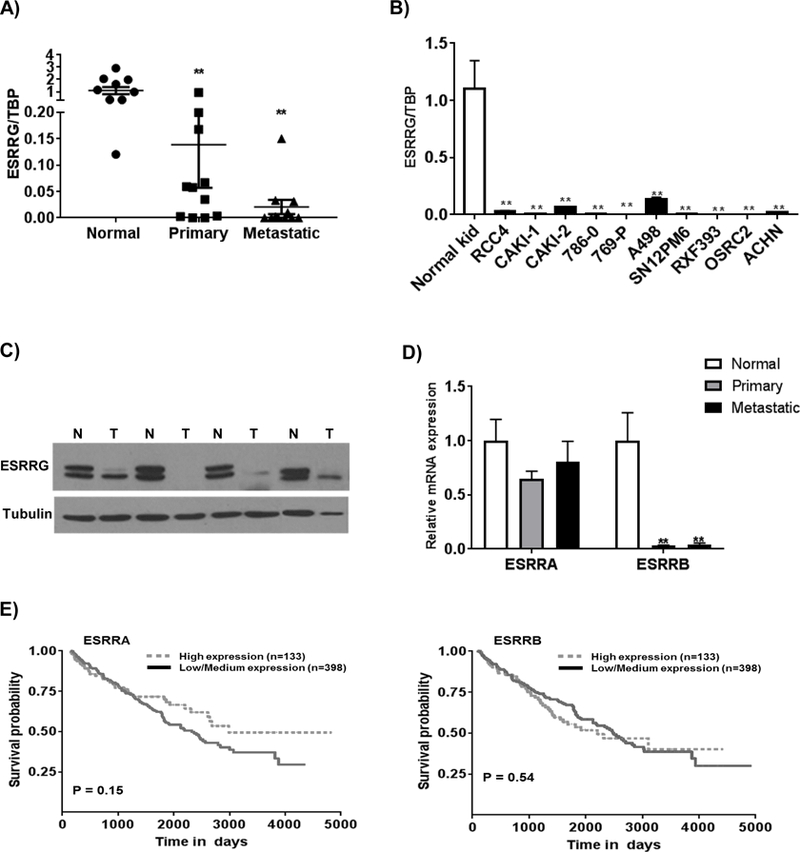
Figure 4. Suppression of ESRRG in RCC.

A) Relative mRNA expression of ESRRG in patient-matched normal kidney, primary tumor, and metastatic tumor (n=11/ group). Asterisks indicate differences relative to normal kidney tissue (**p<0.01). B) ESRRG mRNA expression in a panel of RCC cell lines relative to normal kidney. Transcript levels were normalized to those of TATA-binding protein (TBP). C) Western blot analysis of ESRRG in normal (N) and tumor (T). D) Relative mRNA expression of ESRRA and ESRRB in patient-matched normal kidney, primary tumor, and metastatic tumor (n=11/ group). Asterisks indicate differences relative to normal kidney tissue (**p<0.01). E) Kaplan-Meier survival curve analysis of patients from the TCGA data set on ccRCC based on expression of ESRRA and ESRRB.
