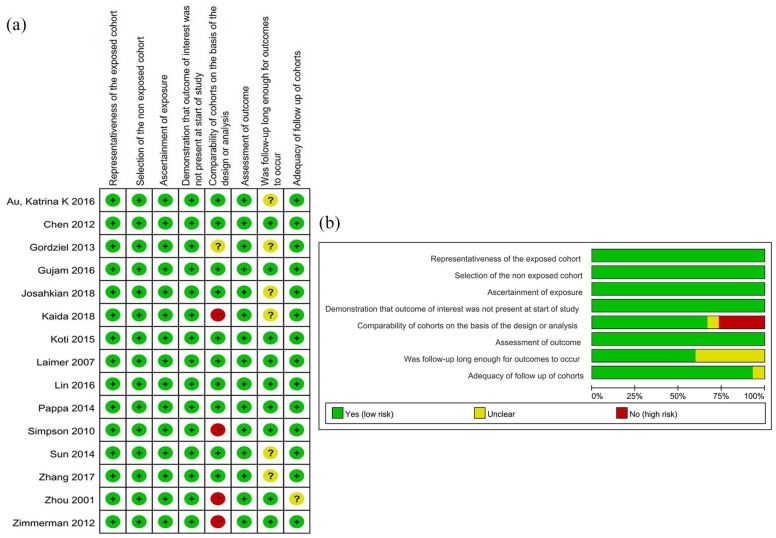
Figure 2.
Quantitative assessment. (A) Risk of bias summary for each included study according to the NOS system. (B) Risk of bias graph by reviewing authors’ judgments about each risk of bias item presented as percentages across all included studies according to the NOS scores.
NOS, Newcastle-Ottawa-scale.

