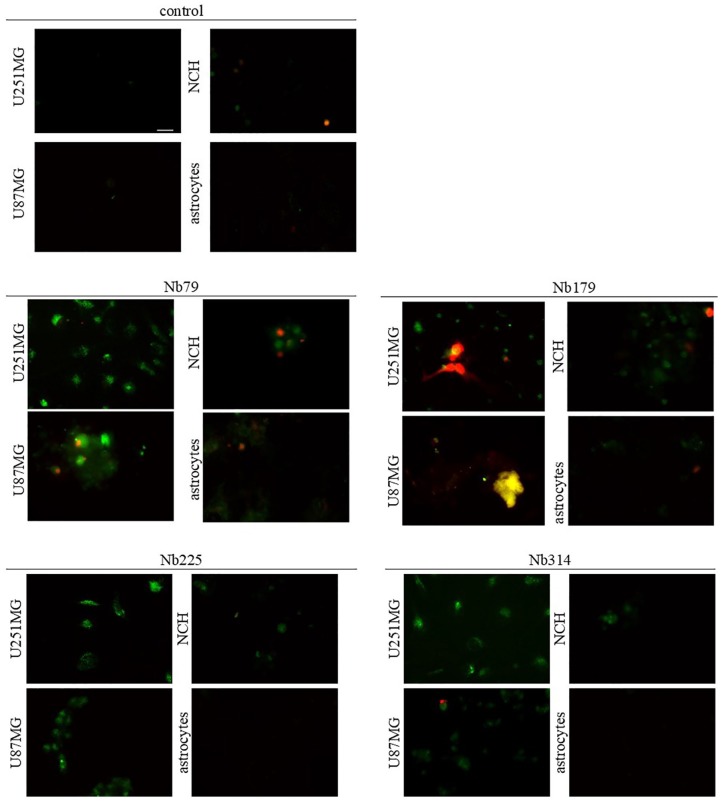
Figure 10.
Representative images for apoptosis/necrosis assays of treatments with the selected nanobodies (as indicated; 100 μg/mL, 24 h) of the cell lines (as indicated). Annexin V (green) shows apoptotic cells; propidium iodide was used to show necrotic cells. Scale bar, 20 μm (top left image; applicable to all images).

