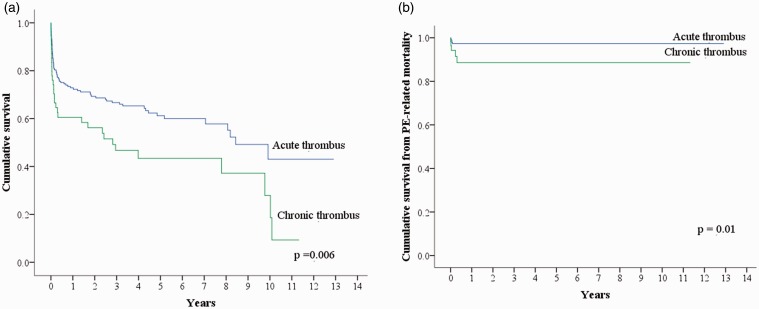
Fig. 2.
Kaplan–Meier curve of cumulative survival. (a) Compared with patients with acute thrombus, patients with chronic thrombus had a higher risk of all-cause mortality (p = 0.006). (b) Compared with patients with acute thrombus, patients with chronic thrombus had a higher risk of death due to PE (p = 0.01).

