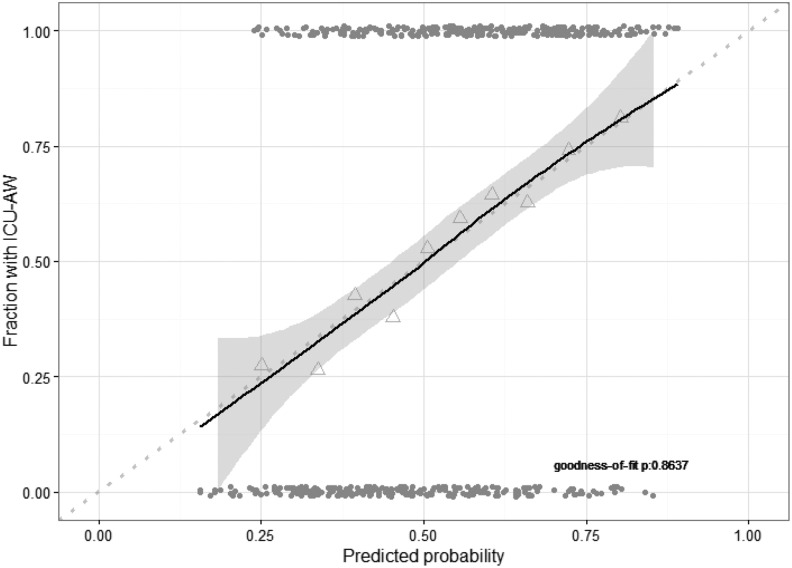
Figure 4.
Calibration plot of new model. Calibration plot of new model based on combined data of the development and validation cohort. Model calibration was assessed with a fitted curve based on Loess regression with 95% confidence interval. Perfect calibration is illustrated by the dotted line. Triangles represent deciles of predicted probability and grey points represent predicted probabilities of individual patients. Goodness of fit was assessed with the Hosmer-Lemeshow test. ICU-AW indicates intensive care unit–acquired weakness.

