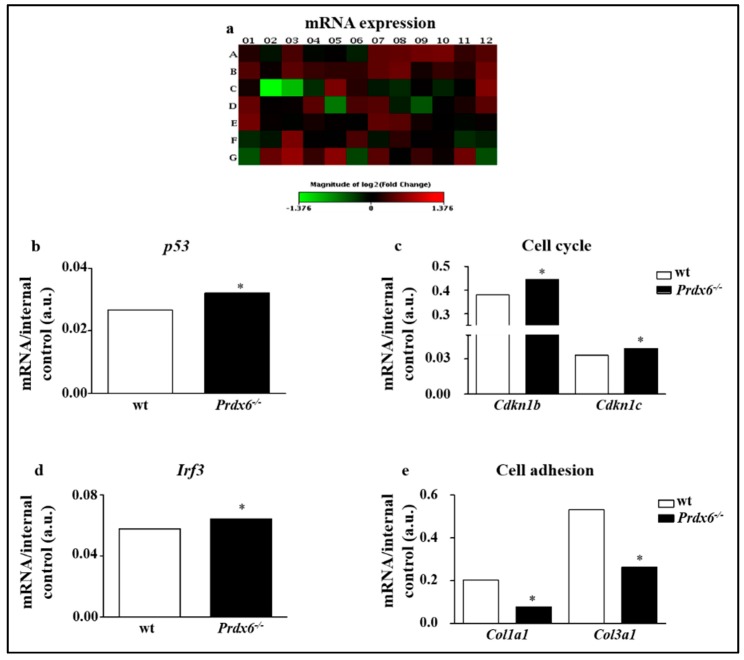
Figure 1.
Prdx6-/- mice showed altered senescence genes profile. (a) Heatmap of expression changes in 84 key genes involved in the initiation and progression of cellular senescence in gastrocnemius skeletal muscle of Prdx6-/- mice. (b–e) Detailed expression levels of the indicated genes and pathways modulated in Prdx6-/- compared to control group. Bar graphs report the average mRNA levels reported as mean ± SD with the respective p-values automatically calculated by the QIAGEN program. All values were normalized with internal controls. * p < 0.05 (n = 5 mice per group).

