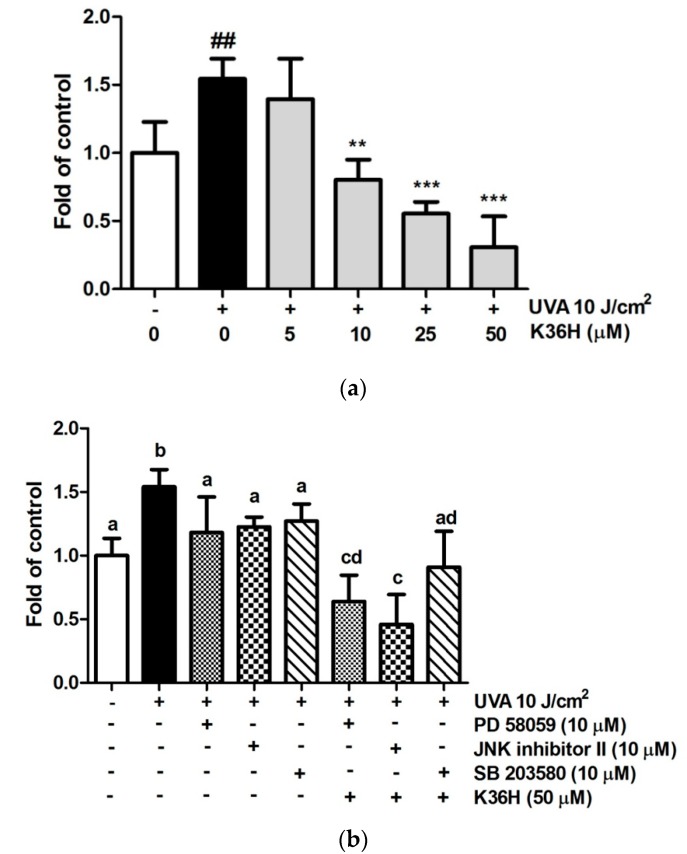
Figure 10.
(a) Effect of K36H on NO level in HaCaT cells. Significant difference versus the nonirradiated group: ## p < 0.01. Significant difference versus the nontreatment group: ** p < 0.01; *** p < 0.001. (b) Effect of MAP kinase inhibitors and K36H on UVA-induced NO production in HaCaT cells. a-d: Groups sharing the same letter are not significantly different (p > 0.05) as revealed by LSD post hoc tests.

