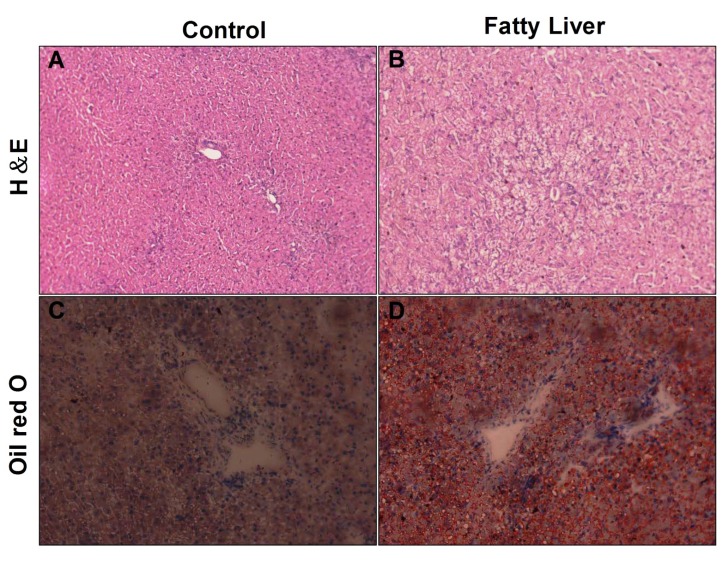
Figure 2.
Assessment of hepatic histology in the liver of the control group and fatty liver group. (A,B) Hematoxylin and Eosin staining of liver sections from the control group and fatty liver group. Original magnification: 20× (C,D) Liver sections were stained with Oil Red O and Hematoxylin stain for nuclei. Original magnification: 20×.

