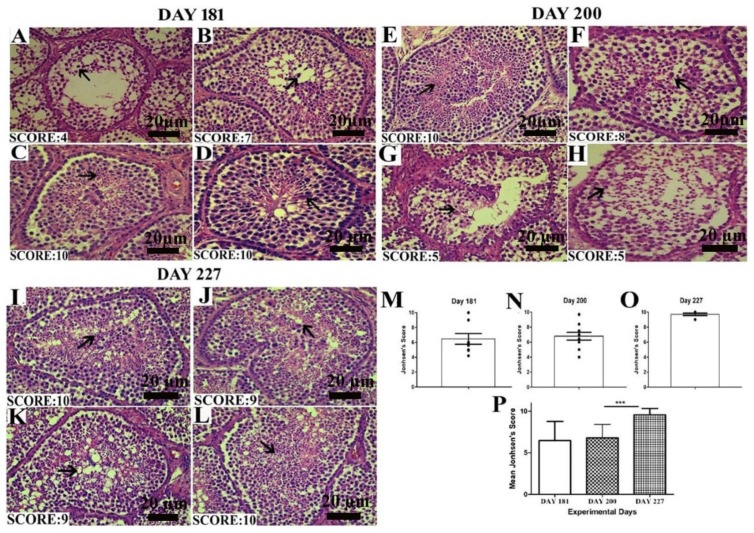
Figure 4.
Images of histological sections on days 181 (A–D), 200 (E–H) and 227 (I–L) showing seminiferous tubules at different stages of spermatogenesis by the Johnsen score. Scale bar 20 µm at 40× magnification. (M–O) Graphical representation of the Johnsen score on days 181, 200 and 227 at a 95% confidence interval. (P) The mean Johnsen score. Data are shown as the mean values ± standard error of the mean, *** indicates difference p < 0.001, respectively between the groups. Scale bar = 20 µm.

