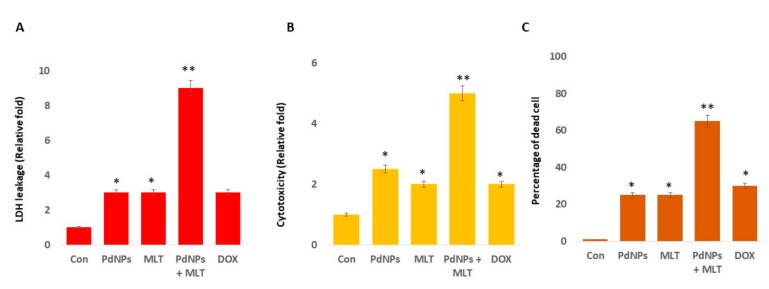
Figure 4.
Effects of PdNPs + MLT in A549 cells. (A) LDH leakage, (B) cytotoxicity, and (C) percentage of dead cells in each of the following treatments: control, 2.5 µM PdNPs, 0.75 mM MLT, 2.5 µM PdNPs combined with 0.75 mM MLT, and 5 µM DOX. Results are shown as the mean ± standard deviation of three independent experiments. The treated groups showed statistically significant differences from the control group per Student’s t-test. * p < 0.05 was considered significant; ** p < 0.01 was considered highly significant.

