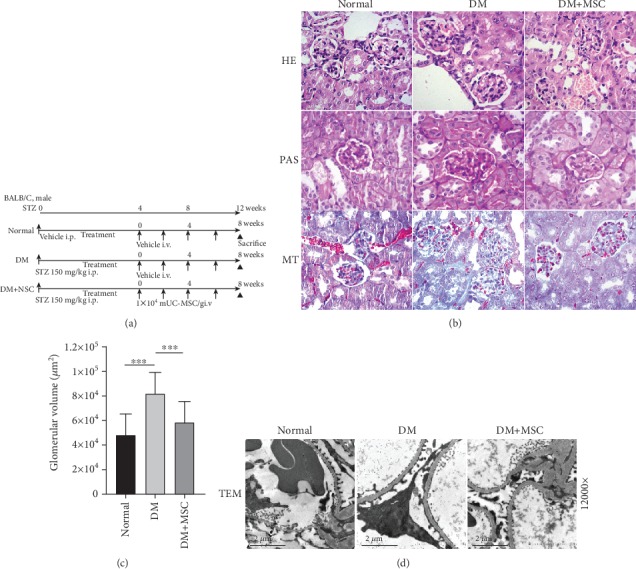
Figure 2.

Representative photomicrographs of kidney sections from mice of the different experimental groups, 8 weeks after transplantation of mUC-MSCs. (a) Experimental protocol for mUC-MSC therapies in streptozotocin- (STZ-) induced diabetic mice. (b) Histological findings of the renal cortex in H&E, PAS, and MT staining kidney sections at 8 weeks after the initial administration of mUC-MSCs in STZ-induced diabetic mice. Bar: 200 μm. (c) Quantification of glomerular volume in mice from normal, diabetic, and MSC groups. Data shown are representative of five panels per animal at ×100 magnification. Data are expressed as mean ± SD of 4–6 animals. ∗∗∗P < 0.001. (d) Ultrastructural TEM analysis of the renal glomerulus in STZ-induced diabetic mice 8 weeks after initial administration of mUC-MSCs. Bar: 2 μm.
