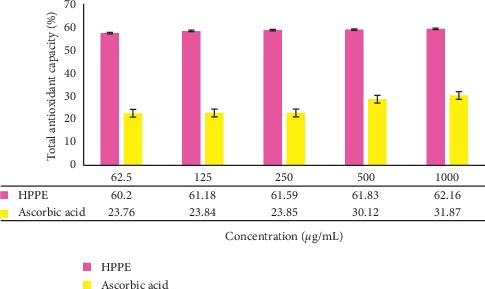
Figure 6.

The total antioxidant capacity of the ethanolic HPPE and the standard solution of ascorbic acid with different concentrations (62.5–1000 μg/mL). Values are the average of duplicate experiments (n = 3) and are represented as mean ± standard deviation. The data were significant as ∗p < 0.05.
