Figure 1.

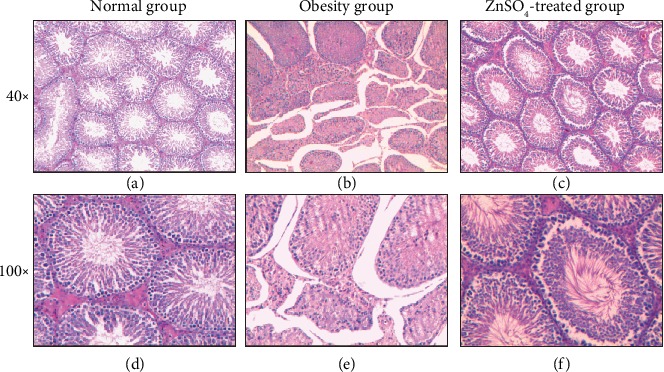
Cross-sectional morphology of the testes for each group at magnification (a–c) 40x and (d–f) 100x by HE staining: (a, d) normal group, (b, e) obesity group, and (c, f) ZnSO4-treated group.

Cross-sectional morphology of the testes for each group at magnification (a–c) 40x and (d–f) 100x by HE staining: (a, d) normal group, (b, e) obesity group, and (c, f) ZnSO4-treated group.