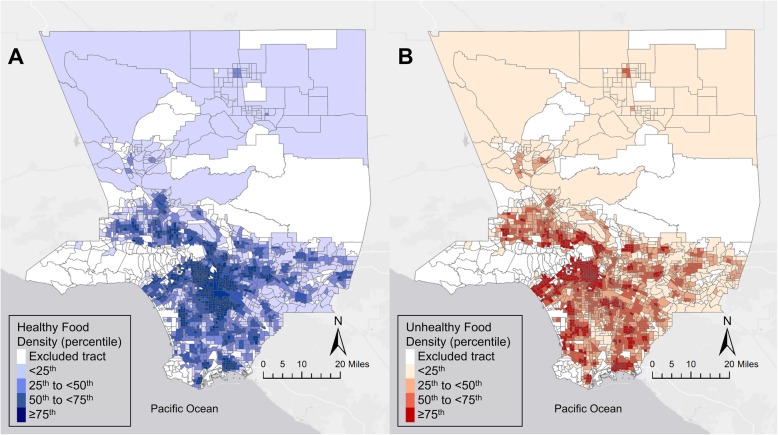
Fig. 1.
Quartiles for average density of healthy1 and unhealthy2 food outlets in 2010 census tracts with a 0.5-mile buffer of WIC-participants in Los Angeles County, California, 2002–2013.3. a Quartiles of healthy1 food outlet density per square mile. b Quartiles of unhealthy2 food outlet density per square mile.1 Healthy outlets included chain and independent grocers, fruit/vegetable vendors, and supermarkets. 2 Unhealthy outlets included chain and independent convenience stores, fast food, and liquor stores.3 The authors created the map for this publication using ArcGIS 10.3 (Environmental Systems Research Institute, Redlands, CA, USA)

