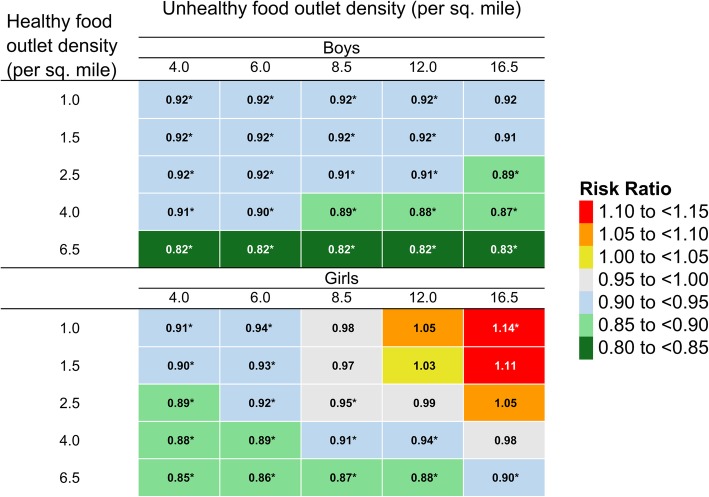
Fig. 2.
Heat map of the association between the new WIC food package and obesity at age 4 in boys and girls in Los Angeles County, California (N = 148,634) by density of healthy and unhealthy food outlets in neighborhood of residence.1. *Indicates statistically significant risk ratios. 1 Healthy outlets included chain and independent grocers, fruit/vegetable vendors, and supermarkets. Unhealthy outlets included chain and independent convenience stores, fast food, and liquor stores. Neighborhood was defined as the census tract of residence + a 0.5-mile buffer for food environment variables and as the census tract of residence for social environment variables. Risk ratios are from Poisson regression models adjusted for healthy food outlet density (linear and quadratic), unhealthy food outlet density (linear), interactions between healthy and unhealthy food outlet densities, child race, initial WHZ, age at last measurement, household income, maternal education and language preference, and neighborhood percent poverty, percent high school graduates, percent non-white and population density. The association between WIC package and obesity risk was assessed with 2-way interactions between WIC package and each food environment variable as well as 3-way interactions between WIC package and the 2-way interactions between healthy and unhealthy densities

