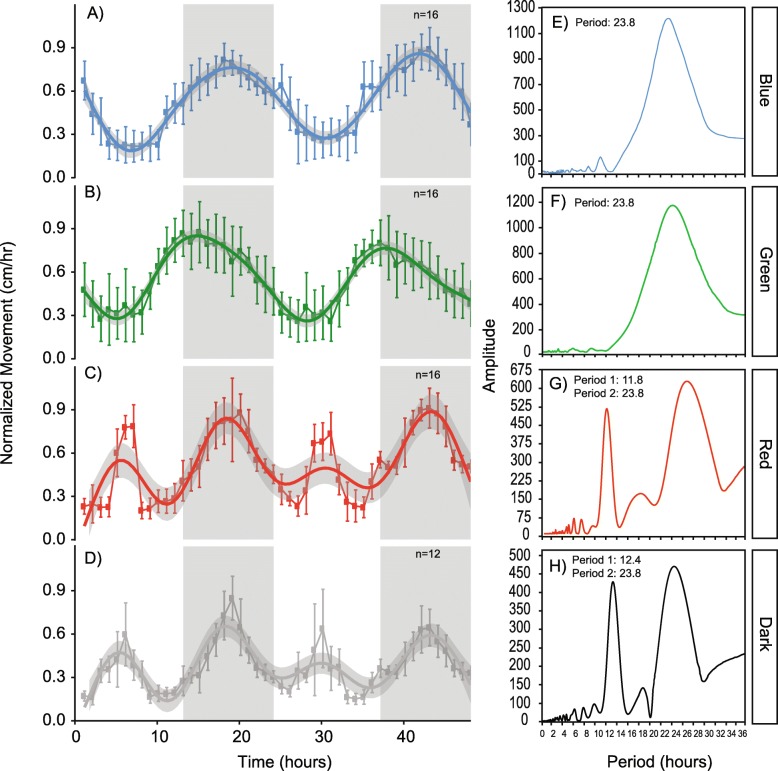
Fig. 2.
Normalized locomotive activity patterns of Nematostella vectensis over time (left panel) in a blue light:dark conditions, b green light:dark conditions, c red light:dark conditions, and d constant dark:dark conditions. The 48-h time course is indicated by the x-axis, and normalized movement (cm/hr) on the y-axis of the left panel behavioral plots. White and grey boxes in the plot area indicate the light:dark cycle, or the photoperiod and scotoperiod of the time course, respectively. Each data point on the behavioral plots represent n replicates (nblue = 16; ngreen = 16, nred = 16; ndark = 12). The right panel (e-h) shows periodograms corresponding to each color (annotated in the far-right box) using Chi-square analysis from activity data for n individuals in each light condition (confidence interval < 0.01). Periodicity values are reported in the top left corner of each graph

