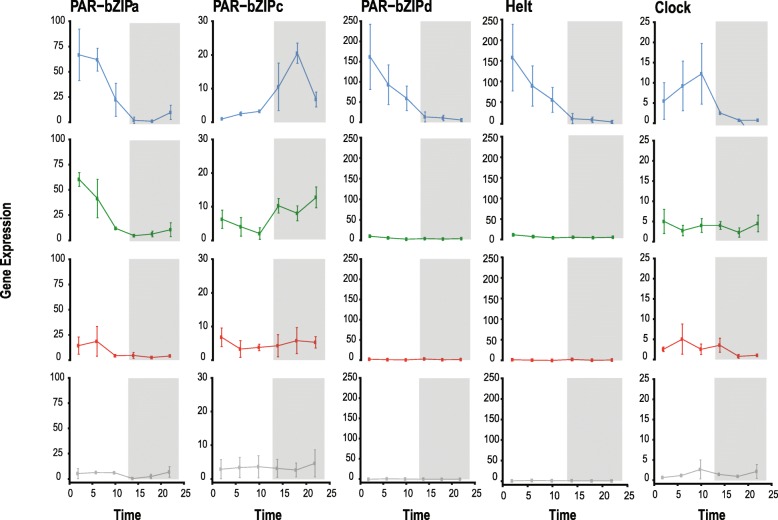
Fig. 4.
Nematostella vectensis candidate circadian gene profiles over the 24-h sequencing time course, organized by gene and color. Each vertical set of plots represents a single gene’s expression in each light condition in the following order: blue, green, red, dark. Data points on each plot represent four individually sequenced animals. Error bars are calculated from the standard error of the mean for each data point (n = 4). The time course of the experiment is shown along the x-axis, and the normalized expression values are shown along the y-axis. Note the scale is the same for each light condition of a specific gene, but the scales differ across genes. White and grey boxes in the plot area indicate the light:dark cycle, or the photoperiod and scotoperiod of the time course, respectively. All statistical values for comparisons can be found in Table S5

