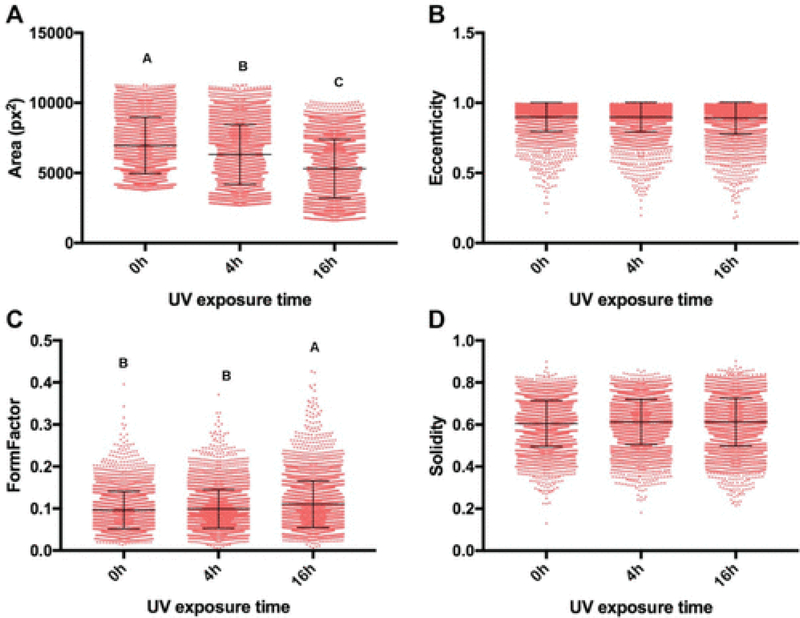
Figure 8:
Dot plots of the measured cell shape features representing single-cell morphological (A) area (pixel), (B) eccentricity, (C) form factor, and (D) solidity are shown for MSCs seeded at both low and high densities on standard tctPS 0hUV (n=2864), tctPS 4hUV (n=3721), and tctPS 16hUV (n=3679) well plates. For each morphological feature, groups not connected by the same letters (a, b, c, and d) are significantly different (p<0.05).

