
Figure 4. TADs are composed of a heterogeneous network of internal looping interactions.
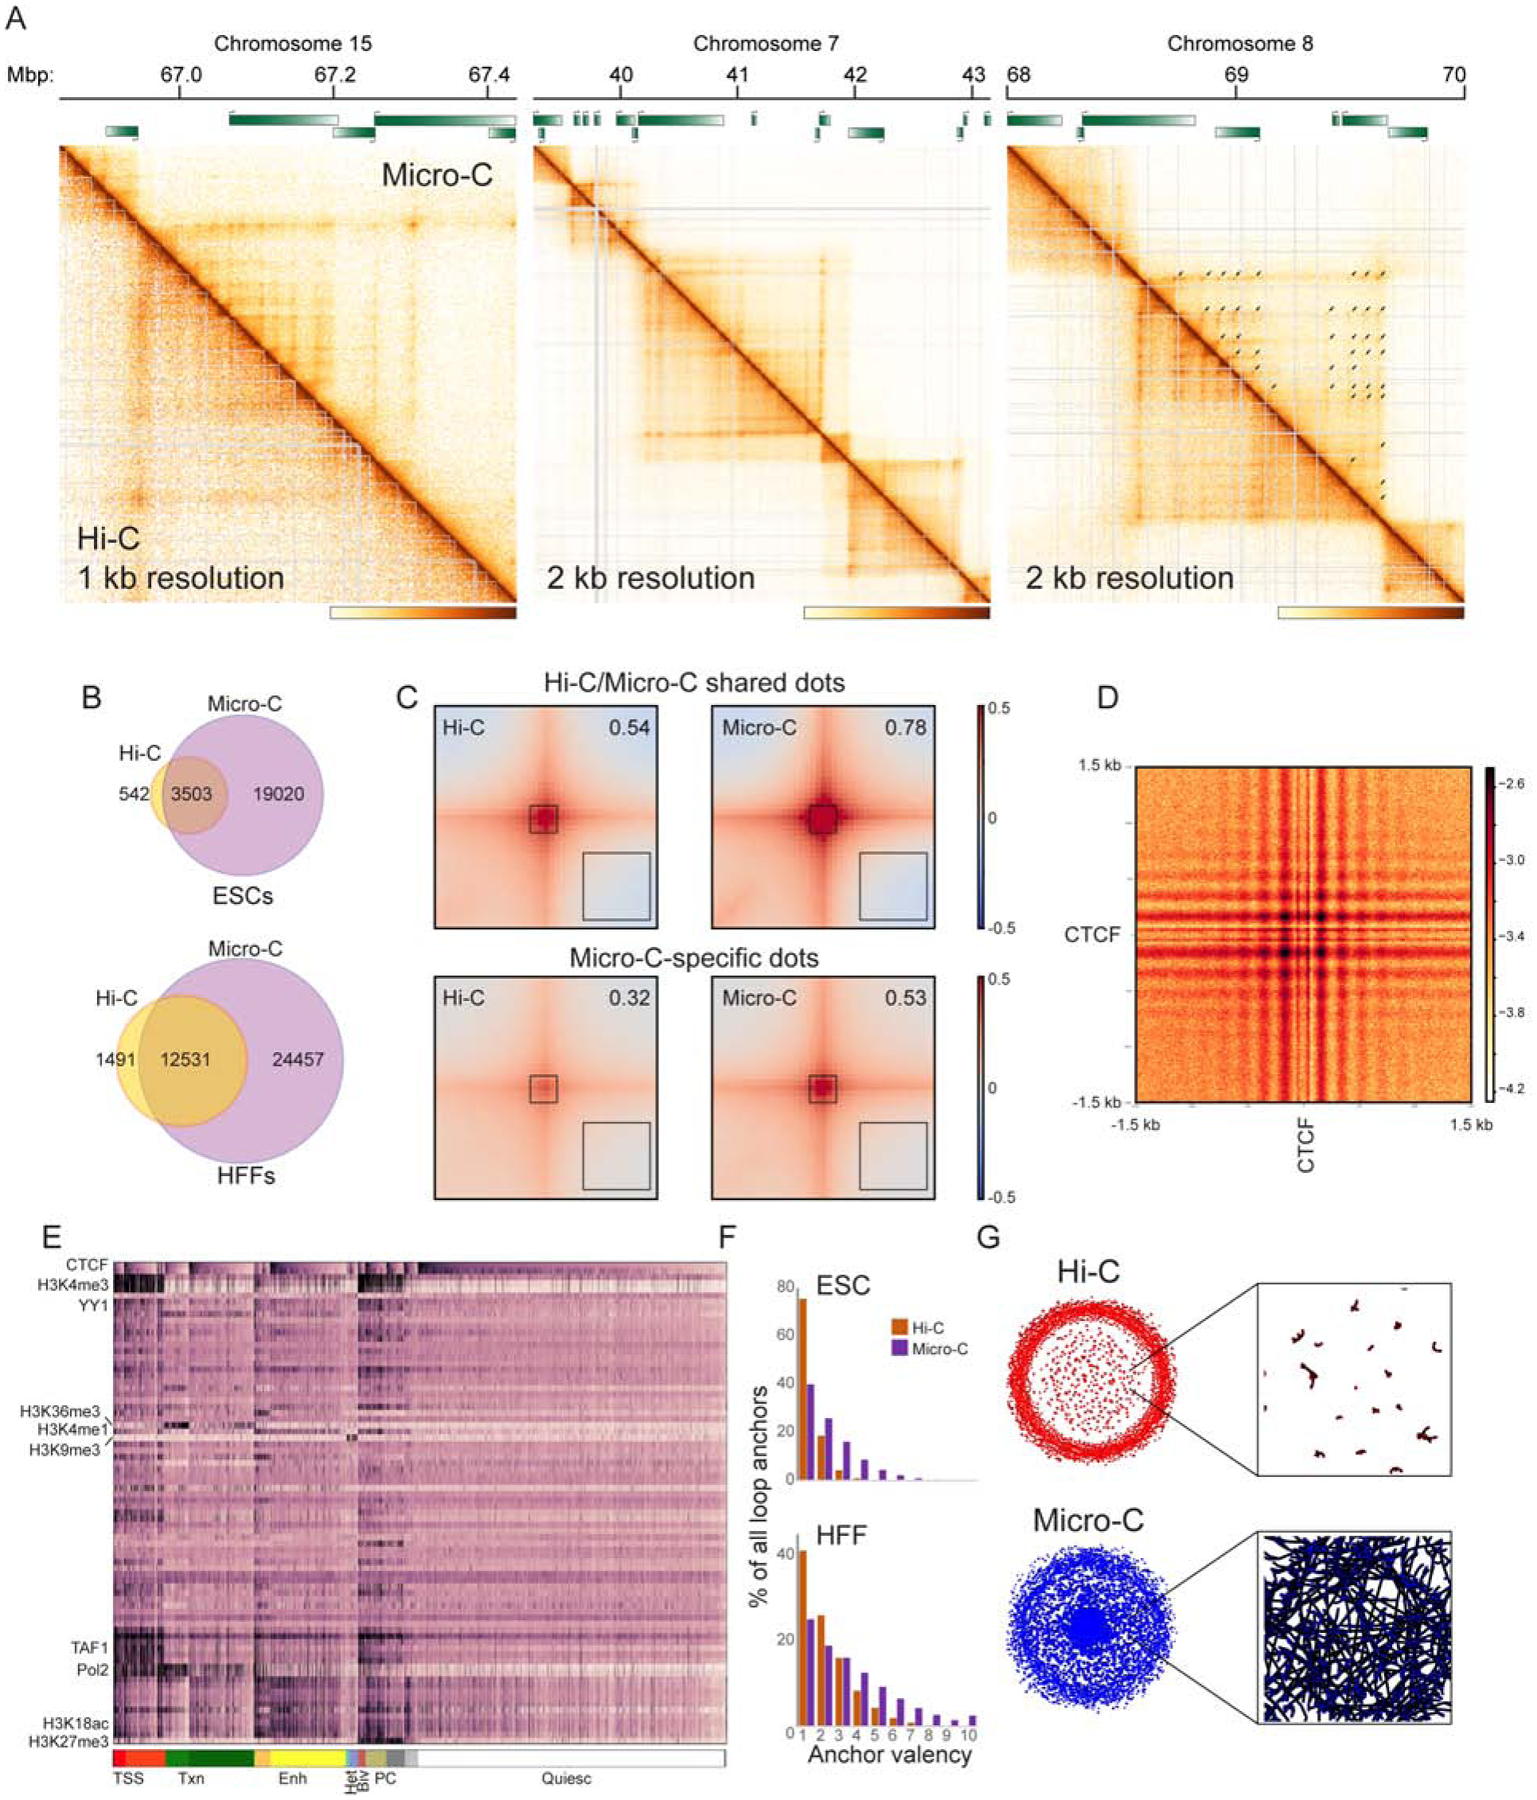
(A) Examples of Micro-C-specific peaks of looping interactions in HFFs. In each case Micro-C contact map is shown above the diagonal, along with corresponding Hi-C heatmap below the diagonal (see also Supplementary Figures S4A–B for ESC examples). Arrows in the right panel show “dots” called in the Micro-C dataset.
(B) Venn diagrams show presumed looping interaction peaks (dots) identified by MicroC and Hi-C in ESCs and HFFs, as indicated.
(C) Heatmaps showing average contact frequency in ESCs for dots called in both Hi-C and Micro-C (top), or in Micro-C only. Heatmaps show data for 200 kb (100 kb upstream and 100 kb downstream) surrounding loop anchors. Number in the upper right hand corner represents the signal strength at the loop base (heatmap center) over the nearby background (black box, lower right corner). See also Supplementary Figure S4C for HFF dataset.
(D) Heatmap showing average contact frequency, at nucleotide resolution, for all pairs of CTCF ChIP-Seq peaks associated with convergently-oriented CTCF motifs at separations between 100 kb and 1 Mb. See also Supplementary Figure S5.
(E) Global view of dot anchor sites. For all anchor sites, enrichment for various chromatin proteins or histone modifications (Davis et al., 2018) was computed. Anchor sites are first sorted according to chromatin state (broad chromatin types indicated at bottom, from left: Transcription Start Sites, Transcribed chromatin, Enhancers, Heterochromatin, Bivalent, Polycomb, and “Quiescent” chromatin depleted of characteristic proteins/modifications), then sorted according to CTCF enrichment within each subcluster. See also Supplementary Figures S6–7.
(F)Micro-C identifies genomic loci with multiple looping interaction peaks. Histograms show the number of looping interaction peaks for any given genomic locus, revealing a clear shift towards multiple peaks in Micro-C compared to Hi-C datasets.
(G)Grid completeness. Left panels show networks constructed from Hi-C (top) and Micro-C (bottom) looping interaction peaks, while right panels show a zoom in from the center of the network. Here, nodes represent genomic loci (anchors), while edges represent interaction peaks between anchor sites (dots).