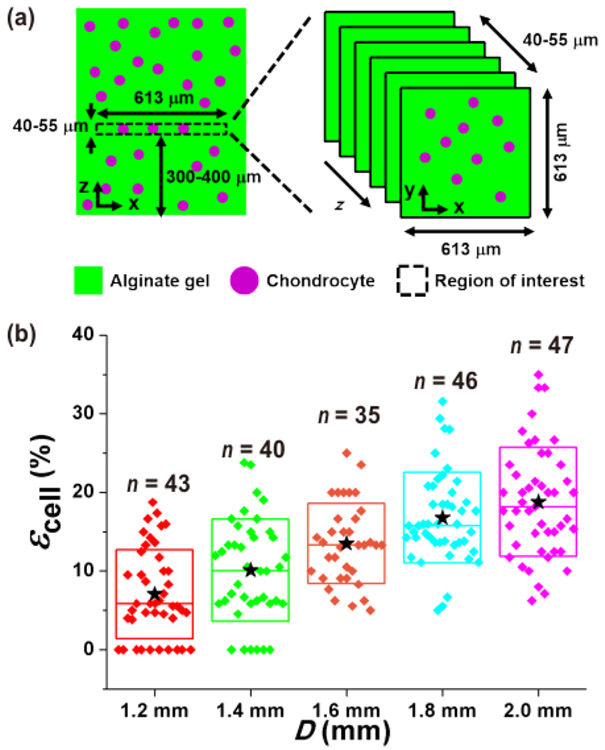
Figure 4. Measurement of chondrocyte deformation under static compression.
(a) A z-stack image [613 μm × 613 μm × 40–55 μm (x × y × z)] was obtained in the middle of the gel construct, 300–400 μm from the gel bottom. (b) Different magnitudes of chondrocyte compressive strain (εcell) resulted as a function of the PDMS balloon diameter (D). ★: mean values. ◆: each data points. Top (or bottom) and middle lines of the box are the standard deviation and median value, respectively. This figure is reproduced from 26.

