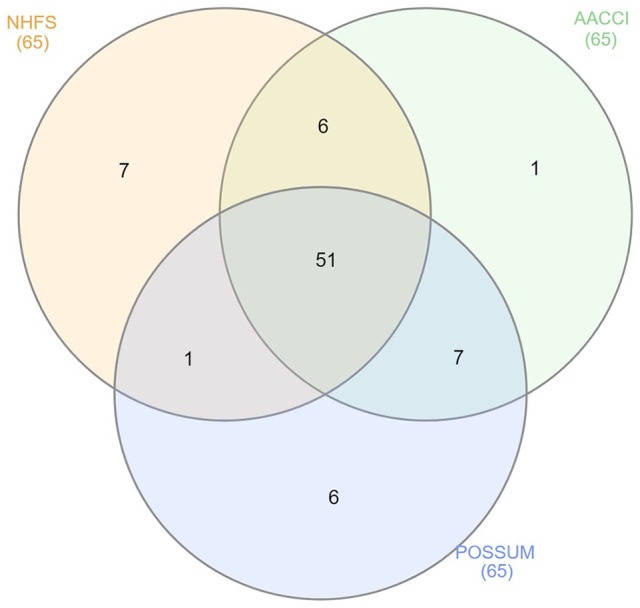
Figure 4.

Venn diagram depicting the overlap of predicted categories (alive vs deceased) of the three models for an individual (n = 65).
NHFS: Nottingham Hip Fracture Score; AACCI: Age-Adjusted Charlson Comorbidity Index; POSSUM: Physiological and Operative Severity Score for enUmeration of Mortality.
