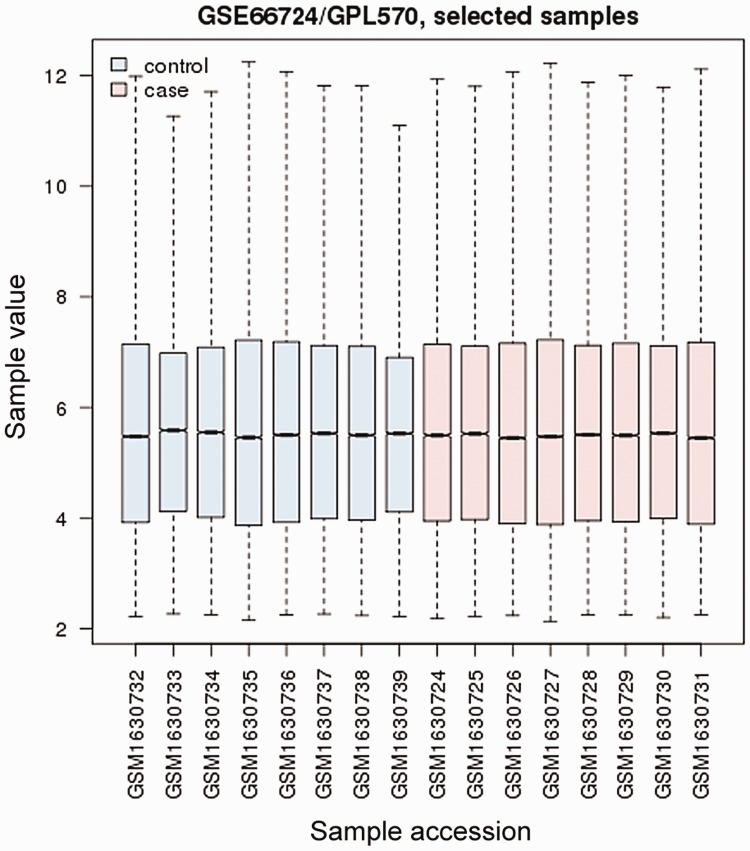
Figure 1.
Cross-comparability assessment of microarray data. Dataset GSE66724 included eight peripheral blood samples from AF patients with stroke (Cases) and eight from AF patients without stroke (Controls). The box plot shows the distribution of value data for the samples selected. The box extends from the first to the third quartile; the line inside the box displays the median; and the whiskers extend from the ends of the box to the smallest and largest data values. AF, atrial fibrillation.

