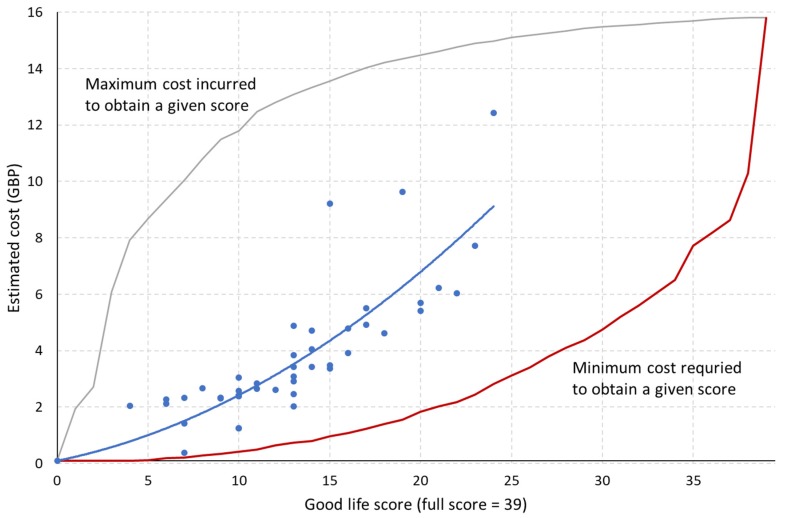
Figure 3.
Relationship between resource tier score and estimated cost to achieve them at sample farms (N = 49). Quadratic trend curve suggests an exponential cost structure (y = 0.01x2 + 0.13x, R2 = 0.71), while the discrepancy between observed data (blue) and the minimum cost required to obtain a given score (red) shows the potential to reduce the expenditure without compromising the overall level of positive welfare.

