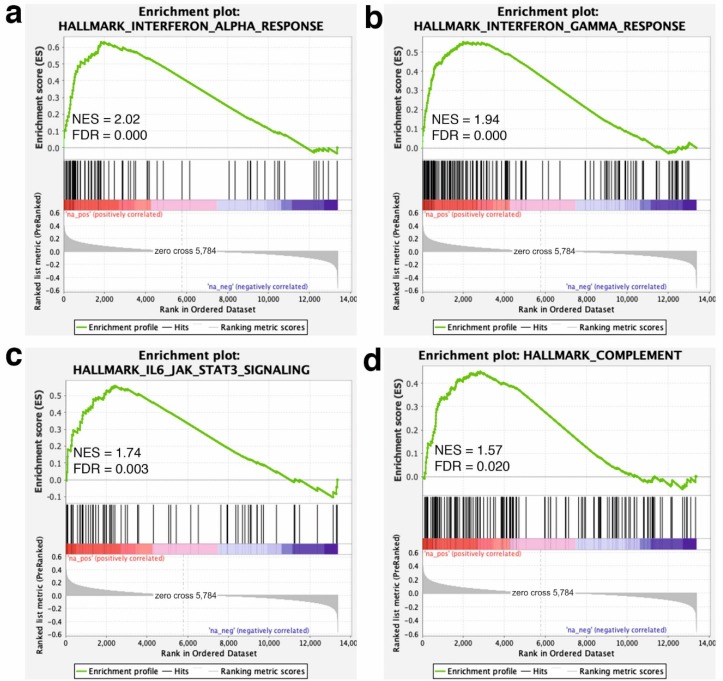
Figure 2.
Gene set enrichment analysis (GSEA) plot (score curves) for enriched hallmarks. The GSEA analysis was performed with the hallmarks gene sets of GSEA Molecular Signatures Database. The “Signal-to-Noise” ratio (SNR) statistic was used to rank the genes per their correlation with the dietary GP supplementation (red) or the un-supplemented CTR phenotype (blue). The heatmap on the right side of each panel visualize the genes mostly contributing to the enriched gene set. For the fully detailed list, see Supplementary Table S3. The green curve corresponds to the Enrichment Score (ES) curve, which is the running sum of the weighed ES obtained from the GSEA software, while the Normalized Enrichment Score (NES) and the corresponding p-value are reported within each graph. Panels (a–d) denote the most enriched (significant) pathways (i.e., gene sets).

