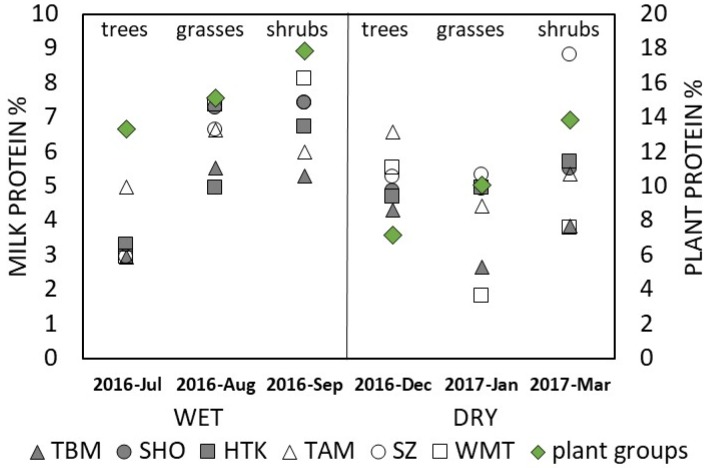
Figure 4.
Seasonal changes in milk protein vs. forage protein by three plant groups. Milk and forage protein values were higher during wet season compared to dry season values (n = 36 milk protein values from six mothers, mothers identified by different symbols; n = 6 mean forage protein values (green symbols) of three different plant groups (trees, grasses, shrubs, according to Table 4).

